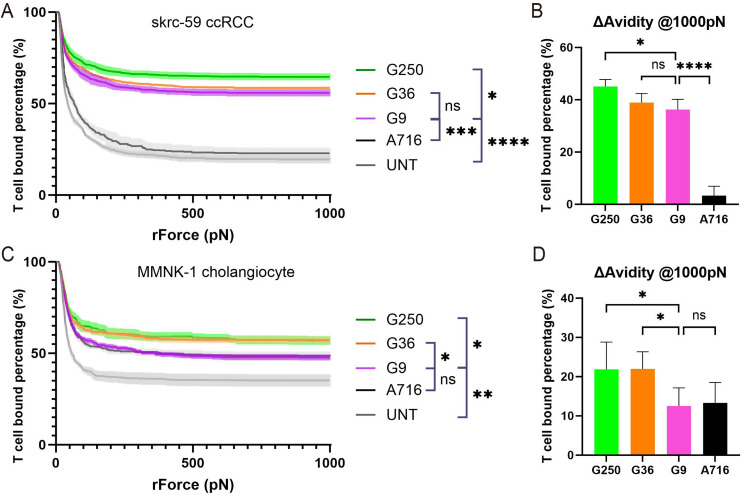
Fig. 3.
Avidity of CAR-T cells on tumor and normal cells. (A) Avidity of CAR-T cells on skrc-59 ccRCC tumor cells. The percentage of G250 (green), G36 (orange), G9 (pink), A716 (black), UNT (grey) binding to skrc-59 ccRCC tumor cells are shown in the plot (n = 4 per group). (B) Avidity of CAR-T cells on skrc-59 tumor cells at 1000 pN endpoint. The normalized percentage of G250 (green), G36 (orange), G9 (pink), A716 (black) binding to skrc-59 ccRCC tumor cells at 1000 pN are shown in the bar plot (the normalized percentage of binding is defined by minus the binding of UNT) (n = 4 per group). (C) Avidity of CAR-T cells on MMNK-1 cholangiocytes. The percentage of G250 (green), G36 (orange), G9 (pink), A716 (black), UNT (grey) binding to MMNK-1 cholangiocytes are shown in the plot (n = 4 per group). (D) Avidity of CAR-T cells on MMNK-1 cholangiocytes at 1000 pN endpoint. The normalized percentage of G250 (green), G36 (orange), G9 (pink), A716 (black) binding to MMNK-1 cholangiocytes at 1000 pN are shown in the bar plot (the normalized percentage of binding is defined by minus the binding of UNT) (n = 4 per group). All data with error bars are presented as mean ± SD. P values are defined by unpaired two-tailed t-tests (∗p < 0.05; ∗∗p < 0.01; ∗∗∗p < 0.001; and ∗∗∗∗p < 0.0001)

