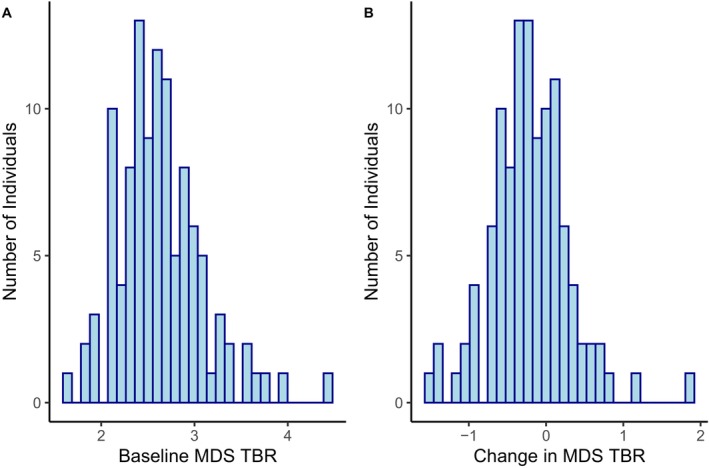
Figure 1. Distribution of most diseased segment target to background ratio.

A, Baseline. B, Change in most diseased segment target to background ratio. MDS indicates most diseased segment; and TBR, target to background ratio.

A, Baseline. B, Change in most diseased segment target to background ratio. MDS indicates most diseased segment; and TBR, target to background ratio.