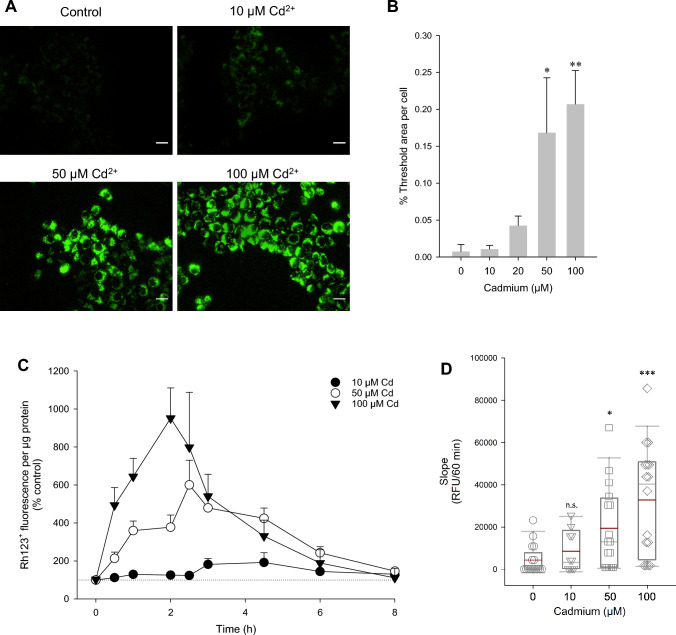
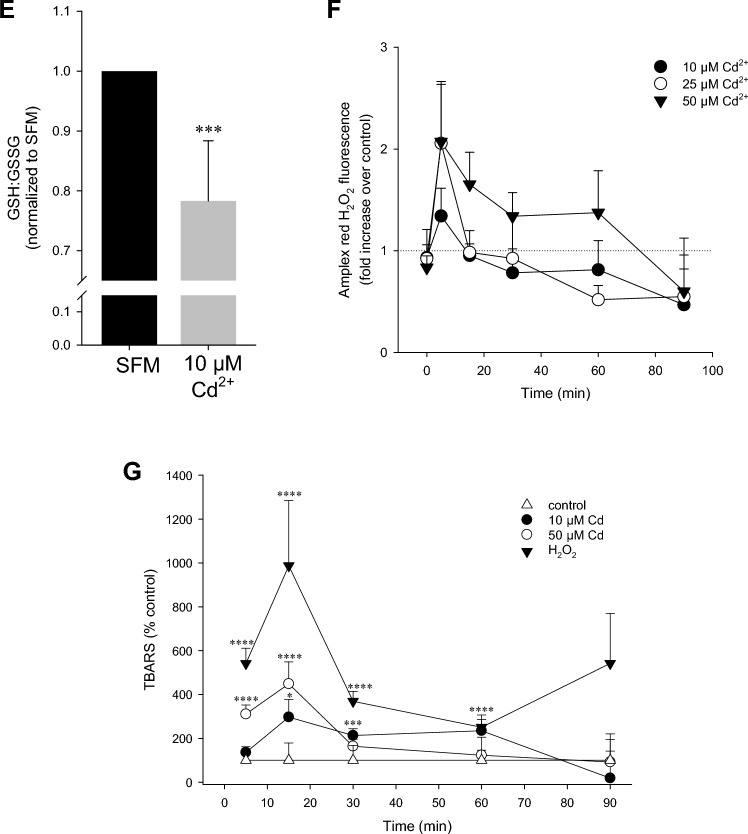
Fig. 1.
Oxidative stress and lipid peroxidation by Cd2+ in WKPT-0293 Cl.2 renal PT cells. Dihydrorhodamine 123 (DHR123) reacts with hydrogen peroxide (H2O2), hypochlorous acid (HOCl), and peroxynitrite anion (ONOO−) to form fluorescent rhodamine 123+ (Rh123+). A WKPT-0293 Cl.2 cells were exposed to varying Cd2+ concentrations for 1 h followed by ROS detection using DHR123. Images were acquired from non-fixed cells using a fluorescence imaging system. Scale bar = 20 µm. B Quantification of thresholded images from (A) from 4 to 5 independent experiments. C Kinetics of Cd2+-induced ROS generation using DHR123. After Cd2+ exposition at each timepoint, cells were incubated with DHR123, washed and lysed with RIPA buffer. Rh123+ fluorescence was determined in a microplate reader. D Slope analysis from the first 60 min of curves in (C) from n = 5–18. E Total cellular glutathione content. Reduced (GSH) and oxidized (GSSG) glutathione were determined after 3 h Cd2+ (n = 4). Unpaired two-tailed t test compares Cd2+ to SFM control. F Time course of H2O2. Measurements were performed after Cd2+ exposure at each timepoint using Amplex Red (n = 4–5). G Time course of lipid peroxidation. Measurements were performed after Cd2+ exposure at each timepoint using the TBARS assay (means ± SEM, n = 13–19). One-way ANOVA with Holm–Sidak posthoc test compares H2O2 or Cd2+-treated cells to non-treated controls [at each timepoint in (G)]


