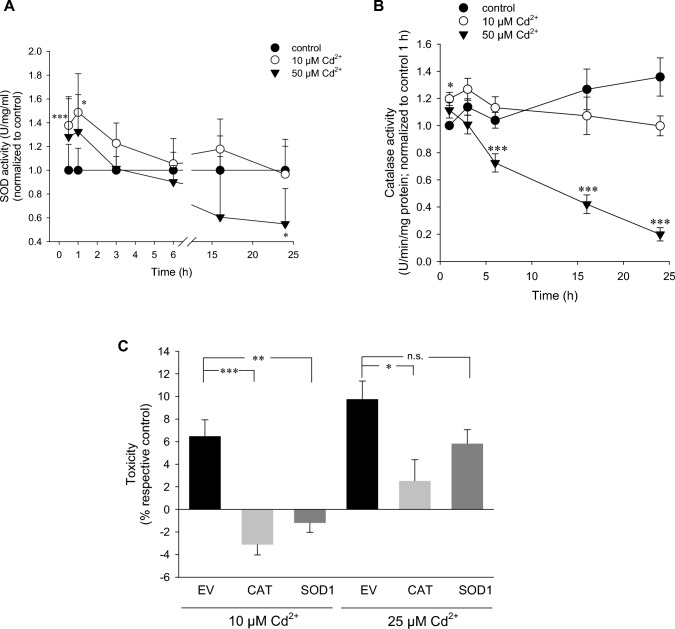
Fig. 4.
Inhibition of SOD and CAT by high Cd2+ contributes to H2O2 dominance. Time course of SOD (A) (n = 5–11) and CAT (B) (n = 18–19) activities after Cd2+ exposure. C Transient transfection of empty vector (EV), human SOD1 or CAT plasmids for 24 h followed by 6 h Cd2+ exposure. Toxicity was determined by MTT assay (n = 4–5). Comparisons between Cd2+ treated and control samples were performed using one-way ANOVA and Holm–Sidak post hoc test at each timepoint

