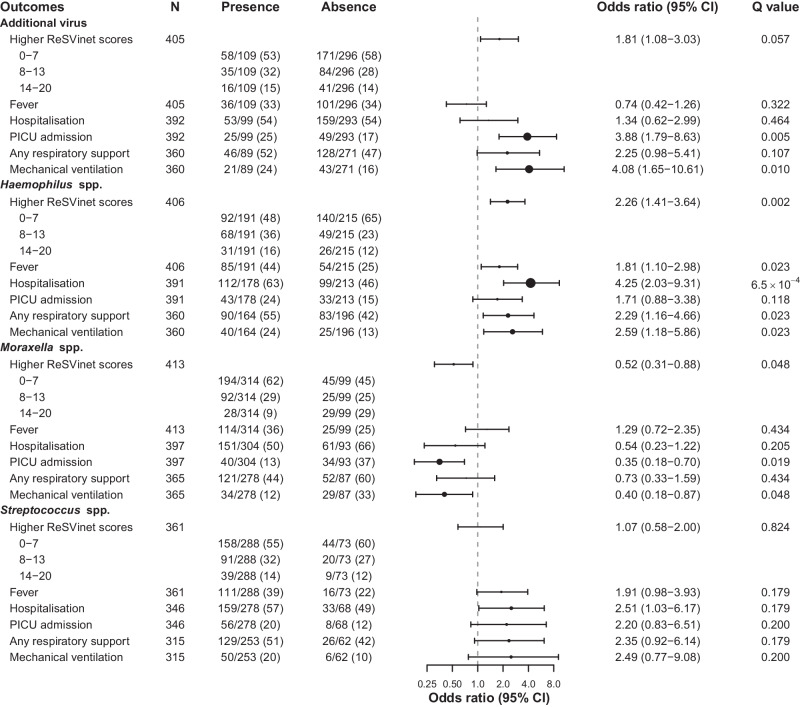
Fig. 2. Clinical outcomes by presence and absence of pathogen groups.
Odds ratios were adjusted for covariates including age, gestational age, sex, comorbidity, sampling season and country, study cohort, RSV subgroup, and peak RSV read count along with the duration between symptom onset and sampling using two-sided ordered logistic regression or two-sided multivariable logistic regression. Q values were adjusted for the false discovery rate using the Benjamini–Hochberg method; a value of less than 0.05 was considered to indicate statistical significance. Data in presence and absence are shown as no./total no. (%). Black dots represent the odds ratio, sized in proportion to Cohen’s f2, ranging from 9.5 × 10⁻⁵ (ReSVinet scores for Streptococcus spp.) to 0.066 (hospitalisation for Haemophilus spp.). Source data are provided as a Source Data file. CI confidence interval, PICU paediatric intensive care unit.

