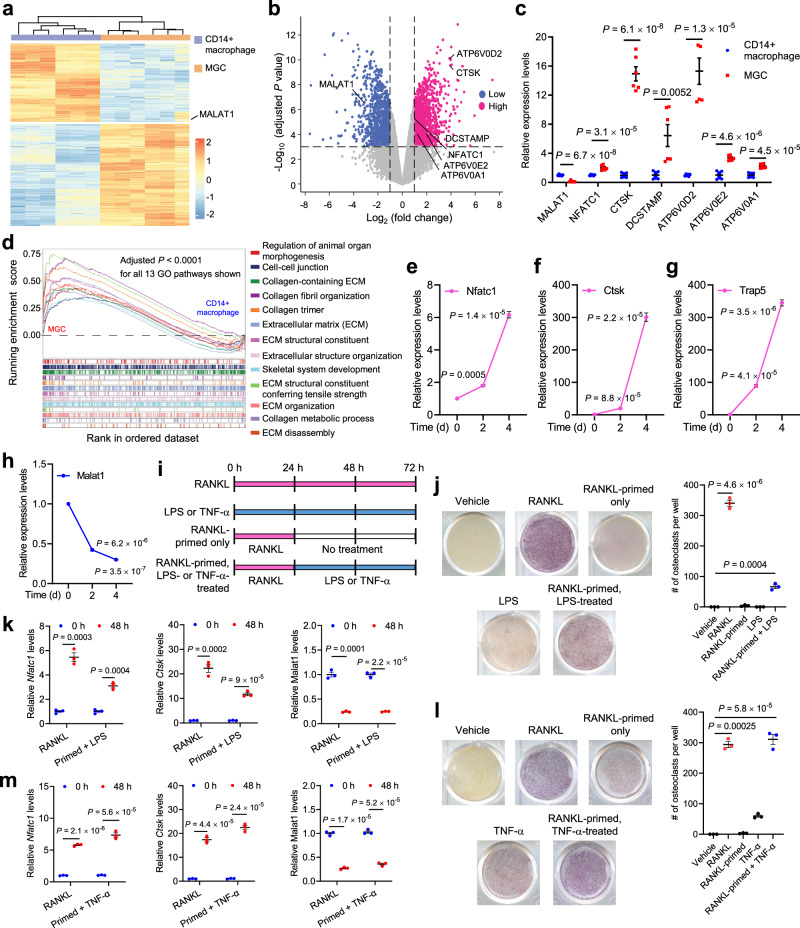
Fig. 1. MALAT1 is downregulated during osteoclast differentiation.
a–d CD14+ human placental macrophages were differentiated into multinucleated giant cells (MGCs) in culture. Both CD14+ macrophages and MGCs were subjected to high-throughput RNA sequencing (RNA-seq). n = 6 biological replicates per group. Data source: GSE38747. a Heatmap of differentially expressed genes between CD14+ macrophages and MGCs. b Volcano plot of genes upregulated (red) or downregulated (blue) in MGCs relative to CD14+ macrophages. Cutoff values: |log2 (fold change)| >1 and adjusted P value < 0.001. Statistical significance was determined by a linear model with Benjamini–Hochberg correction. c Relative expression levels of MALAT1 and osteoclast markers were quantitated from the RNA-seq results. d Gene set enrichment analysis (GSEA) of the RNA-seq data, showing the top 13 Gene Ontology (GO) pathways. Statistical significance of the pathway enrichment score was determined by an empirical phenotype-based permutation test. Normalized enrichment scores (NES) and enriched pathways with an adjusted P value < 0.05 are listed in Supplementary Data 1. e–h qPCR of Nfatc1 (e), Ctsk (f), Trap5 (g), and Malat1 (h) in RAW264.7 cells treated with soluble RANKL (50 ng/mL) for the indicated times. n = 3 biological replicates per group. i Schematic representation of the treatments used to evaluate the osteoclastogenic activity of RANKL, LPS, and TNF-α, with or without pretreatment (priming) with RANKL. j TRAP staining images (left panel) and quantification (right panel) of RAW264.7 cells treated with RANKL or LPS, with or without pretreatment with RANKL. n = 3 wells per group. k qPCR of Nfatc1, Ctsk, and Malat1 in the cells described in j. n = 3 biological replicates per group. l TRAP staining images (left panel) and quantification (right panel) of RAW264.7 cells treated with RANKL or TNF-α, with or without pretreatment with RANKL. n = 3 wells per group. m qPCR of Nfatc1, Ctsk, and Malat1 in the cells described in l. n = 3 biological replicates per group. Statistical significance in c, e–h, and j–m was determined by a two-tailed unpaired t test. Error bars are s.e.m. Source data are provided as a Source Data file.

