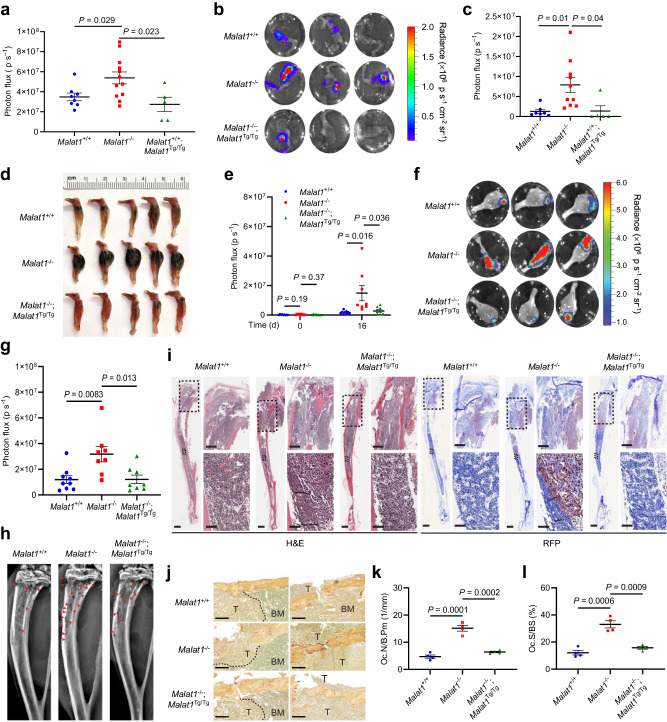
Fig. 3. Malat1 protects against bone metastasis of melanoma and mammary tumor cells.
a 6-month-old Malat1+/+, Malat1−/−, and Malat1−/−;Malat1Tg/Tg male mice received intratibial injection of 5000 B16F1 melanoma cells. Bioluminescent imaging of live animals was performed at the indicated times. n = 8, 12, and 5 mice per group. b–d Bioluminescent imaging (b), quantification of photon flux (c), and photos (d) of the tibiae of 6-month-old male Malat1+/+, Malat1−/−, and Malat1−/−;Malat1Tg/Tg mice at day 26 after intratibial injection of 5000 B16F1 melanoma cells. n = 7, 10, and 5 mice per group. e 3-month-old female Malat1+/+, Malat1−/−, and Malat1−/−;Malat1Tg/Tg mice received intratibial injection of 2 × 10⁵ EO771 mammary tumor cells. Bioluminescent imaging of live animals and quantification of photon flux were performed on day 0 (n = 9, 8, and 9 mice per group) and day 16 (n = 9, 8, and 8 mice per group). f, g Bioluminescent imaging (f) and quantification of photon flux (g) of the tibiae of 3-month-old female Malat1+/+, Malat1−/−, and Malat1−/−;Malat1Tg/Tg mice at day 16 after intratibial injection of 2 × 10⁵ EO771 cells. n = 9, 8, and 8 mice per group. h Representative X-ray images of the tibiae of the mice described in f. The red arrowheads indicate osteolytic lesions appearing as tiny “holes” in the bone cavity. i H&E staining and immunohistochemical staining of RFP of the tibiae of the mice described in f. Scale bars, 3 mm (left panels); 700 μm (upper right panels); and 100 μm (lower right panels). j–l TRAP staining of tibiae (j), the number of osteoclasts per bone perimeter (Oc.N/B.Pm, k), and osteoclast surface per bone surface (Oc.S/BS, l) of the mice described in f. The dashed lines outline the borders between tumor tissues (T) and bone marrow tissues (BM). n = 4 mice per group. Scale bars in j, 200 μm. Statistical significance in a, c, e, g, k, and l was determined by a two-tailed unpaired t test. Error bars are s.e.m. Source data are provided as a Source Data file.

