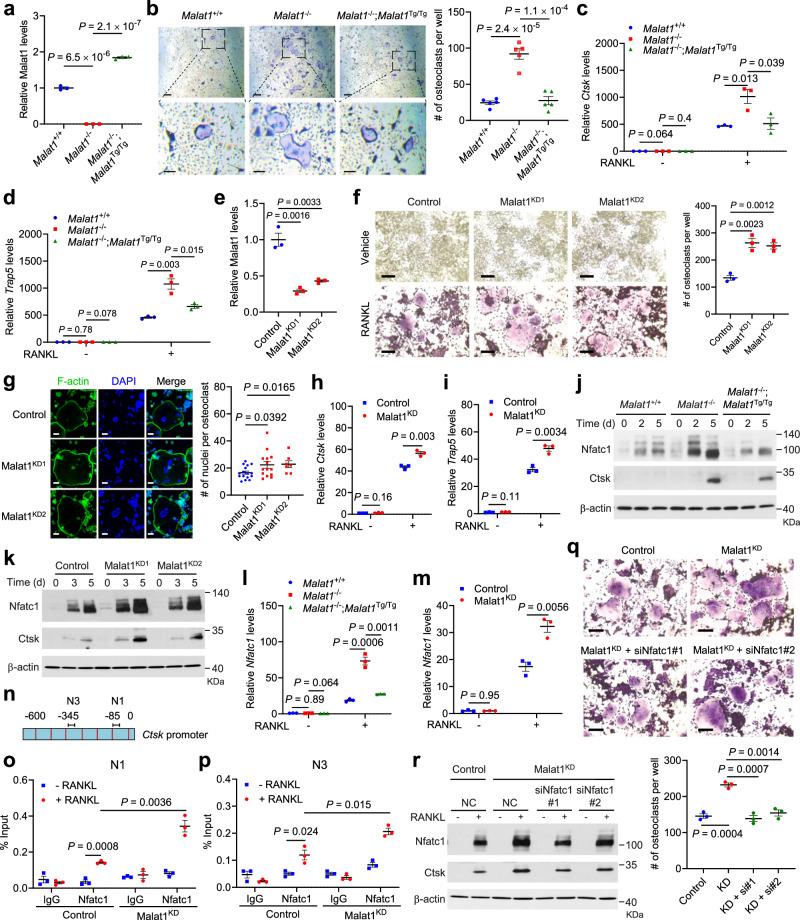
Fig. 5. Malat1 deficiency promotes osteoclastogenesis through Nfatc1.
a qPCR of Malat1 in BMMs from Malat1+/+, Malat1−/−, and Malat1−/−;Malat1Tg/Tg mice. b TRAP staining (left) and quantification (right) of Malat1+/+, Malat1−/−, and Malat1−/−;Malat1Tg/Tg BMMs treated with M-CSF and RANKL. Scale bars, 125 μm (upper) and 50 μm (lower). n = 5 wells per group. c, d qPCR of Ctsk (c) and Trap5 (d) in the BMMs described in b. e qPCR of Malat1 in Malat1-knockdown RAW264.7 cells. f TRAP staining (left) and quantification (right) of RANKL-treated control and Malat1-knockdown RAW264.7 cells. Scale bars, 100 μm. n = 3 wells per group. g Left: RANKL-treated control and Malat1-knockdown RAW264.7 cells were stained with Phalloidin Green 488 and DAPI. Right: data quantification. Scale bars, 50 μm. n = 16, 14, and 7 cells per group. h, i qPCR of Ctsk (h) and Trap5 (i) in RANKL-treated control and Malat1-knockdown RAW264.7 cells. j, k Immunoblotting of Nfatc1, Ctsk, and β-actin in Malat1+/+, Malat1−/−, and Malat1−/−;Malat1Tg/Tg BMMs treated with M-CSF and RANKL (j), and in RANKL-treated control and Malat1-knockdown RAW264.7 cells (k). l, m qPCR of Nfatc1 in Malat1+/+, Malat1−/−, and Malat1−/−;Malat1Tg/Tg BMMs treated with M-CSF and RANKL (l), and in RANKL-treated control and Malat1-knockdown RAW264.7 cells (m). n The mouse Ctsk promoter. Primers previously reported for amplifying N1 and N3 regions were used for ChIP-qPCR. o, p ChIP-qPCR showing the occupancy of the N1 (o) and N3 (p) regions of the Ctsk promoter by Nfatc1 immunoprecipitated from RANKL-treated control or Malat1-knockdown RAW264.7 cells. q, r Control and Malat1-knockdown RAW264.7 cells were transfected with negative control (NC) or Nfatc1 siRNA. After 24 h, the cells were treated with RANKL for 5 days, followed by TRAP staining and quantification (q). Scale bars, 100 μm. Cell lysates were subjected to immunoblotting of Nfatc1, Ctsk, and β-actin (r). n = 3 wells per group. Statistical significance in a–i, l, m, and o–q was determined by a two-tailed unpaired t test. Error bars are s.e.m. n = 3 biological replicates in a, c–e, h, i, l, m, o, and p. The experiments in j, k, and r were repeated independently three times, yielding similar results. Source data are provided as a Source Data file.

