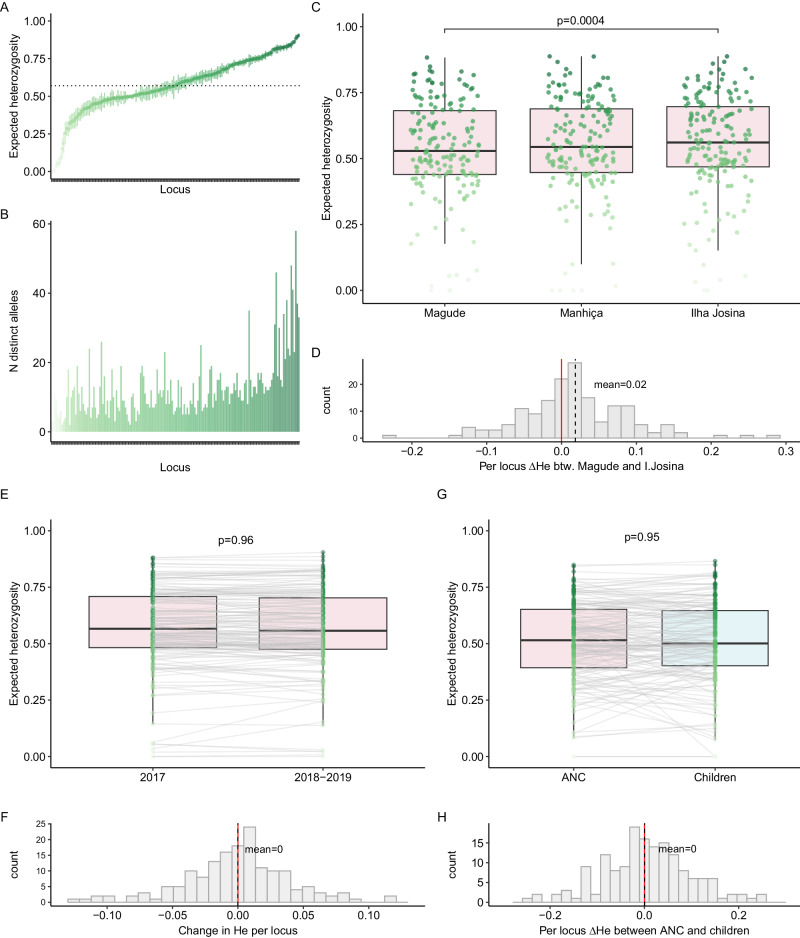
Fig. 3. Population-level Plasmodium falciparum genetic diversity among first antenatal care users and children.
A Expected heterozygosity (He) and 95% confidence interval for each microhaplotype (n = 165) across the population of pregnant women attending their first antenatal care visit (n = 289) estimated with MOIRE (R package). Mean HE across all loci indicated with a dotted line. Darker shade of green reflects higher diversity. B Number of distinct alleles observed for each locus (ordered by increasing HE as in A). C HE per locus for each area among ANC users. A single random subsampling without replacement of Magude and Ilha Josina was performed to balance sample size with Manhiça (n = 64). D Per-locus difference in HE between Magude and Ilha Josina. Overall difference between the two areas assessed with a linear mixed model with random intercepts and slopes per locus. E HE per locus for 2017 and 2018–2019 among ANC users. Random subsampling of 2017 performed to balance sample size with 2018–2019 (n = 123). Loci connected between years by gray lines. F Per-locus difference (Δ) in HE between years. Overall difference between years assessed with a linear mixed model with random intercepts and slopes per locus. G HE per locus for ANC users (pink) and children aged 2–10 years from the community (light blue) in overlapping years. Random subsampling of ANC users performed to balance sample size with children (n = 33), matching area of residence. H Per-locus difference in HE between children and ANC users. Overall difference between the two areas assessed with a linear mixed model with random intercepts and slopes per locus. Boxes indicate the 25th and 75th percentiles with the centre line indicating the median, and the whiskers indicate the smallest value within 1.5 times interquartile range below the 25th percentile, and the largest value within 1.5 times the interquartile range above 75th percentile. P values in C, E–G are from F-tests. Adjusted for multiple testing using the Benjamin–Hochberg method, a p value of <0.0062 indicates statistical significance.

