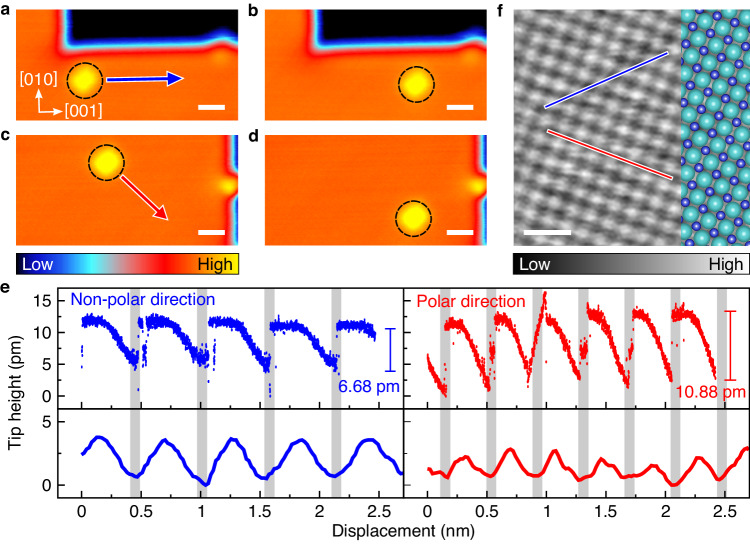
Fig. 2. Lateral manipulation of a single water molecule on the terrace.
a–d STM images of a single water molecule on the 3 ML terrace before and after a lateral manipulation along (a, b) the non-polar direction (blue arrow) and (c, d) the polar direction (red arrow), respectively (Vs = 200 mV, It = 50 pA). The molecules were manipulated under Vs = 200 mV and It = 800 pA at a speed of 50 pm s−1. e Tip-height traces of the molecules on the terraces (blue dots; non-polar direction, red dots; polar direction) and surface corrugations (blue line; non-polar direction and red line; polar direction) from f. The shaded region indicates the position of Na+ ion. f High-resolution STM images of the 3 ML NaCl terrace (Vs = 200 mV, It = 200 pA). Scale bars in a–d and f represent 1 nm. Blue and red lines are the surface corrugations along non-polar and polar directions in e, respectively. Blue and blue-green spheres are superimposed to represent Na+ ions and Cl– ions, respectively.

