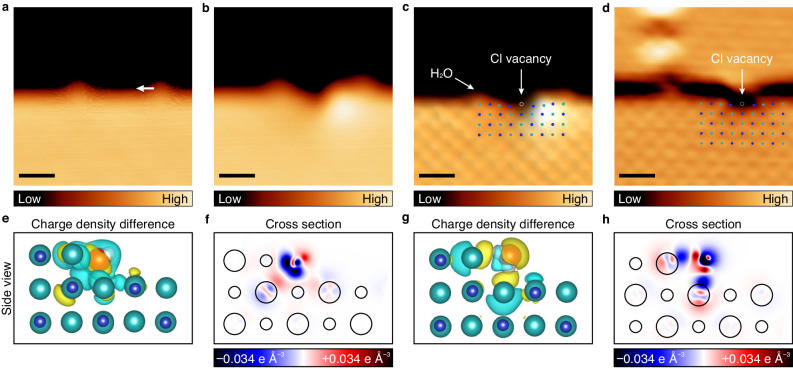
Fig. 5. Selective dissolution of a single Cl– ion from the step.
a, b STM images of water molecules at the step edge before and after manipulation along a white arrow, respectively (Vs = 300 mV, It = 50 pA). c High-resolution STM image of b showing a single Cl– vacancy (Vs = 300 mV, It = 500 pA). d Flattened STM image of another example of the selective dissolution in Supplementary Fig. 7j, clarifying displaced ions near the vacancy (Vs = 400 mV, It = 500 pA). Scale bars in a–d represent 1 nm. In c and d, blue and blue-green dots indicate Na+ and Cl– ions and dotted circles represent vacant Cl– sites of the steps. e–h Side view of charge density difference and cross-sectional plots of the water molecule at the Na+ site (e, f) and at the Cl– site of the step (g, h) calculated by DFT. Blue, blue-green, red, and white spheres represent Na+ ions, Cl– ions, oxygen atoms and hydrogen atoms, respectively. In e and g, yellow (cyan) indicates an area of electron accumulation (electron depletion). In f and h, large (small) circle indicates the position of Cl– ion (Na+ ion).

