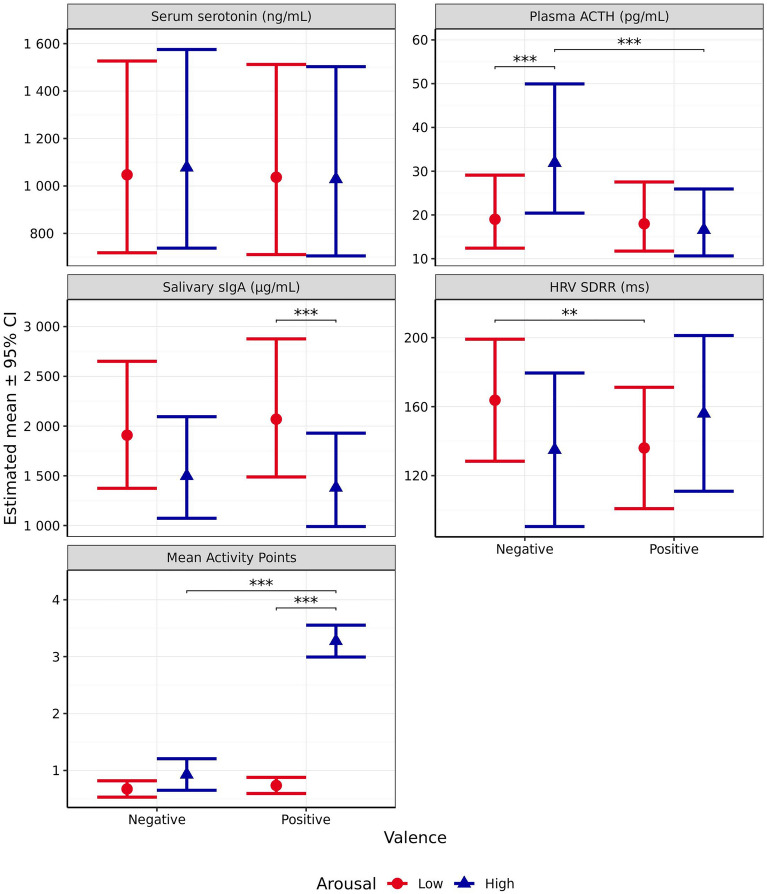
Figure 7.
Estimated means (± 95% CI) for blood serum serotonin (ng/mL), plasma ACTH (pg/mL), salivary sIgA (µg/mL), heart rate variability measured using SDRR (ms), and mean Activity Points following test scenarios anticipated to produce responses varying in valence (negative vs positive) and arousal (high vs low). These scenarios included those anticipated to produce negative valence low arousal (separation), negative valence high arousal (car), positive valence low arousal (petting), and positive valence high arousal (toy play). *** indicates a significant difference of p < 0.001.

