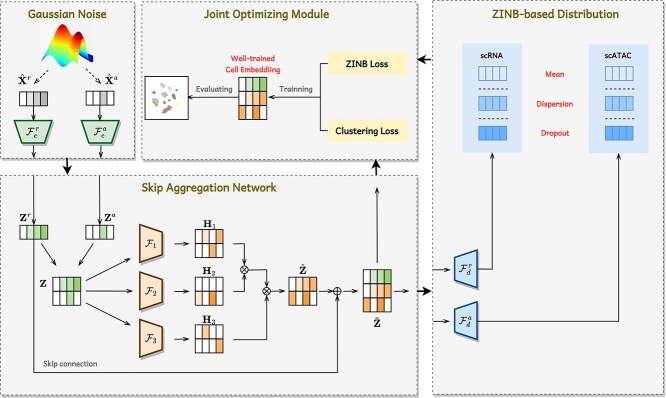
Figure 1.
Illustration of the framework of scEMC. The whole process is divided into four stages. Following the introduction of Gaussian noise, the original numerical matrices of scRNA and scATAC data are input into an autoencoder. Afterward, the cell embeddings  and
and  from both modalities undergo effective fusion via an SAN, with a focus on preserving the utmost information from the informative scRNA modality. The final cell representations
  derived from the SAN network are decoded to produce three data distributions. These distributions are employed to calculate the ZINB loss, which is jointly optimized alongside the clustering loss of the representations.

