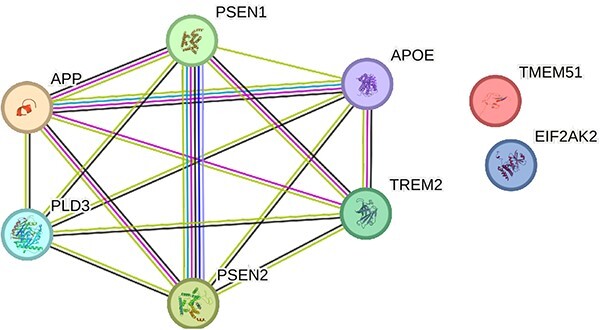
Figure 1.

Alzheimer’s disease gene interaction network input to this network: TREM2, PLD3, DLGPAP1, TMEM51, EIF2AK2, APP, PSEN1, PSEN2, APOE. Genes that are known to interact with each other are connected by cyan lines (information obtained from curated databases) or magenta lines (experimentally determined connections). The genes that could be in the same neighborhood are connected by green lines, those that could have gene fusions are linked by red lines and those genes that could co-occur are linked by blue lines.
