Figure 2.

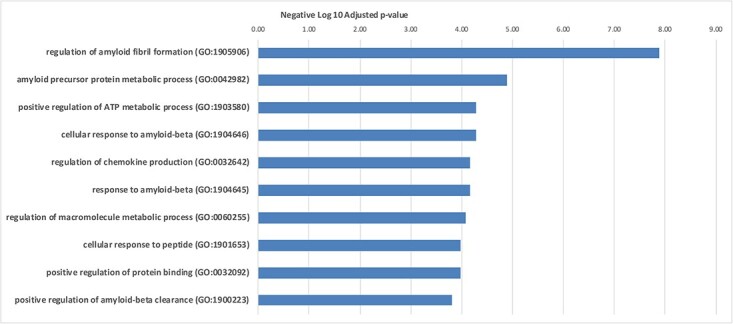
Top enriched gene ontology biological processes in AD. The x axis shows the negative log base 10 of the adjusted P value. The y axis indicates the various GO terms enriched.

Top enriched gene ontology biological processes in AD. The x axis shows the negative log base 10 of the adjusted P value. The y axis indicates the various GO terms enriched.