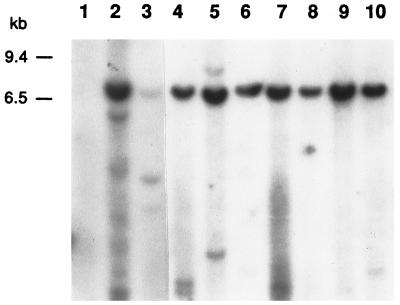
FIG. 3.
Detection of HTLV-2 proviral integration forms in clonal populations of T lymphocytes. Southern Blot analyses of HTLV-2 transformants digested with a combination of AseI/EcoRV as described in the text and hybridized with probe pMO-4. Lane 1, negative control; lane 2, LAMP/MO; lanes 3 to 10, HTLV-2 transformants. Low-molecular-weight bands (<1 kb) seen in lanes 2, 4, 5, 7, and 10 most likely represent cellular-probe degradation products.

