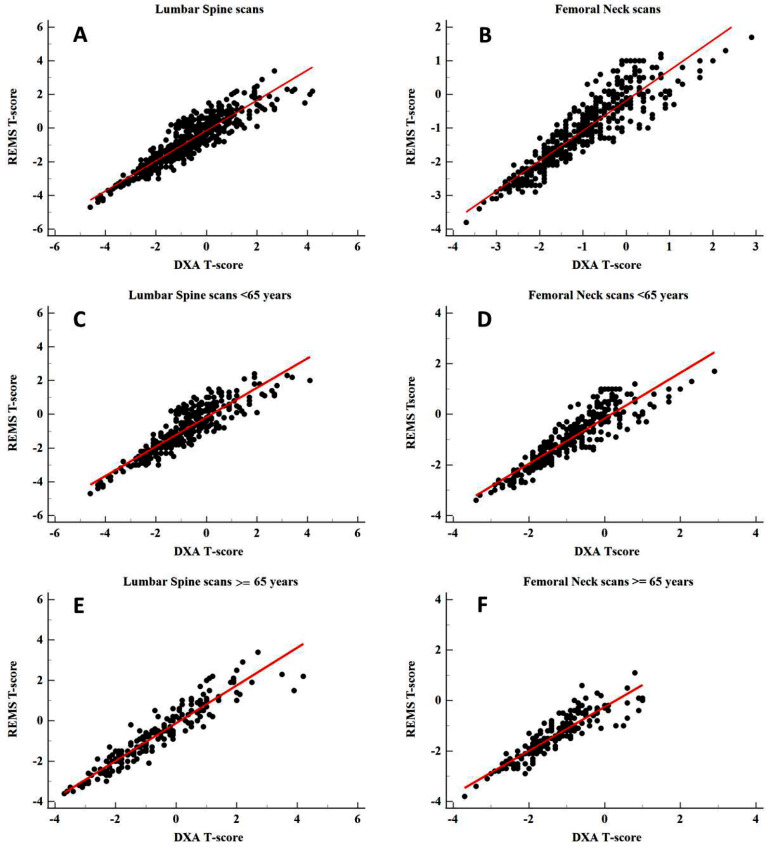
Fig. 1.
Scatterplot of DXA T-score and REMS T-score. In panel A, C and E, values obtained from lumbar spine scans are shown: the slope of the regression line is 0.91 for the total population, 0.89 for group A and 0.94 for group B, Pearson correlation coefficient r = 0.91 (p < 0.0001) for the total population, 0.89 (p < 0.0001) for group A and r = 0.94 (p < 0.0001) for group B; in panel B, D and F, values obtained from femoral neck scans are shown, with slope of the regression line 0.90 for the total population, 0.90 for group A and 0.90 for group B, Pearson correlation coefficient r = 0.90 (p < 0.0001) for the total population, 0.90 (p < 0.0001) for group A and 0.90 (p < 0.0001) for group B

