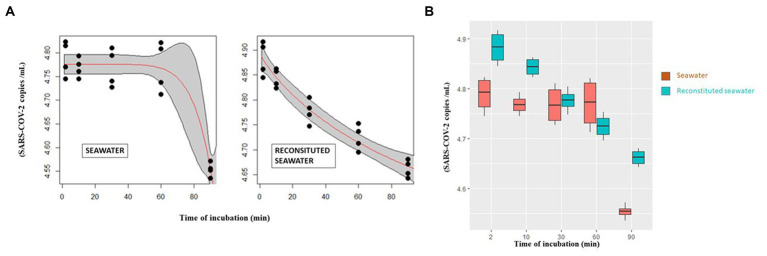
Figure 2.
(A) Curves describing the abundance of infectious virions after incubation with seawater (left) and reconstituted seawater (right) in relation to time as modeled by Weibull 1.3 and Weibull 1.4 mathematical models, respectively. (B) SARS-CoV-2 number of intracellular infecting virions (vertical axis) after different incubation time points (0–90 min) (horizontal axis) with seawater or reconstituted seawater.

