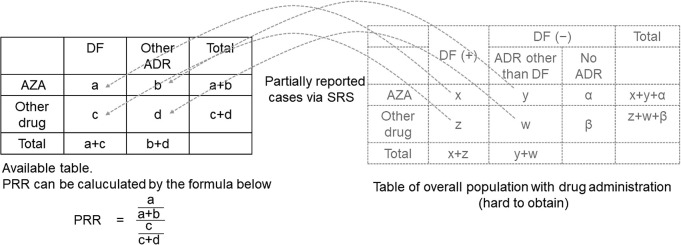
Fig. 2 . An example of two-by-two contingency table in disproportionality analysis.
To calculate the risk of azathioprine (AZA)-induced drug fever and compare the risk with other drugs, data of the whole population with AZA and other drug administrations are necessary; however, such data are unavailable. However, the number of spontaneously reported cases of AZA and other drug administrations with drug fever and ADR other than drug fever is available in the pharmacovigilance database. Researchers can create a two-by-two contingency table from these data. The proportional reporting ratio (PRR) can be calculated from the table using the formula. If the PRR exceeds a certain value, AZA and drug fever may occur.

