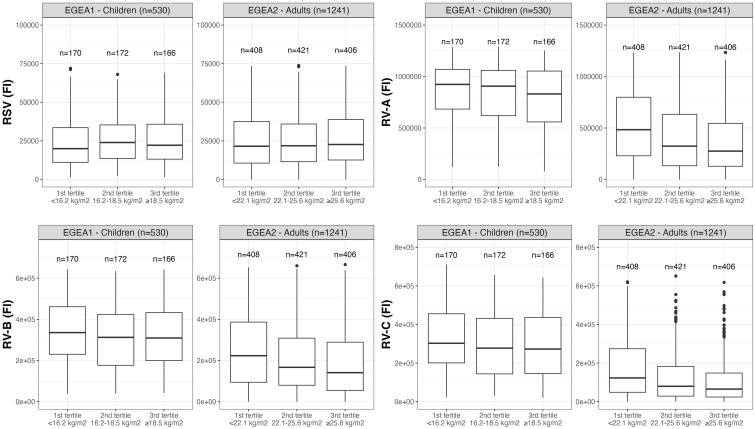
Figure 5.
Distribution of RSV- and RV-specific IgG levels among tertiles of BMI in children (EGEA1, n=531) and adults (EGEA2, n=1241). Data expressed in fluorescence intensity (FI) values (y:axes) corresponding to RSV- and RV-A/B/C-specific antibody levels are shown as box plots. The lower and upper horizontal lines (hinges) correspond to the first and third quartiles (the 25th and 75th) percentiles. The horizontal line between the first and the third quartile correspond to the median. The upper whisker (vertical line) extends from the hinge to the largest value no further than 1.5*IQR from the hinge (where IQR is the inter-quartile range, or distance between the first and third quartiles). The lower whisker (vertical line) extends from the hinge to the smallest value at most 1.5*IQR of the hinge. Data beyond the end of the whiskers are called "outlying" points and are plotted individually. RSV: respiratory syncytial virus; RV: rhinovirus; EGEA: Epidemiological study on the Genetics and Environment of Asthma; BMI: body mass index.

