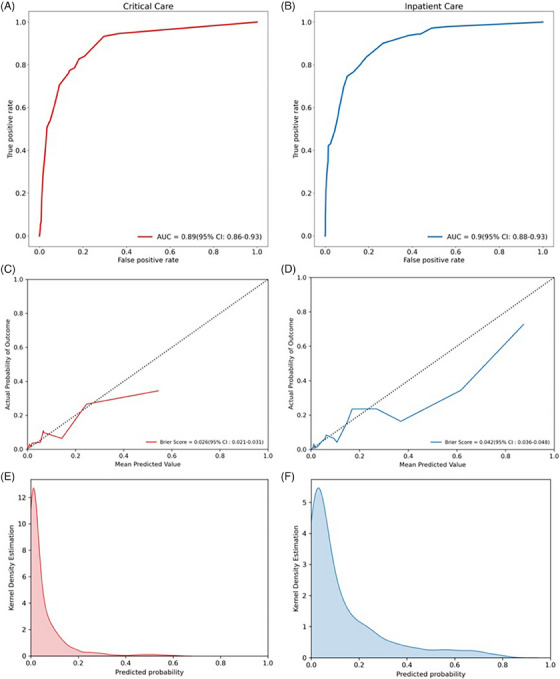
FIGURE 2.

Final model performance. Receiver operating characteristics curves with area under the curve (AUC) for critical care (red) and inpatient care (blue) prediction models are shown in panels A and B, respectively; model calibration curves with Brier scores are shown in panels C and D; distribution of predicted probabilities across the cohort is shown using kernel density estimation plots in panels E and F.
