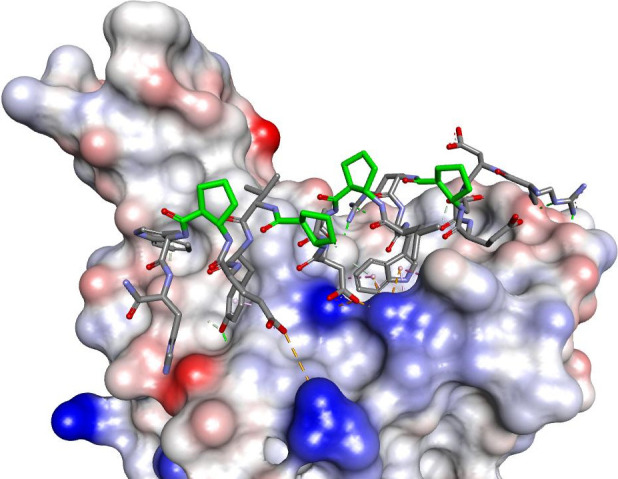
Figure 14.

Modeled complex of peptide-RBD of the S protein. The inhibitory peptide is shown in stick representation colored according to atom type, and β-amino acid carbon atoms are colored in green. The RBD of the S protein is shown as a solvent-accessible surface that is colored according to interpolated charge (red–negative, blue–positive, gray–neutral). Interactions are shown as dashed lines with the same color scheme as shown in Figure 1.
