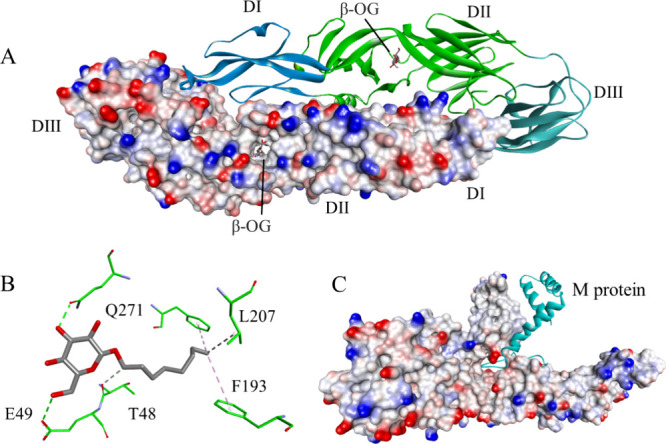
Figure 21.

(A) The crystal structure of a DENV2 envelope glycoprotein homodimer (PDB id: 1OKE).202 One chain is shown in the ribbon representation with blue marking the DI, green – DII, and cyan – DIII. The other chain is shown as a solvent-accessible surface colored according to the interpolated charge (red–negative, blue–positive, gray–neutral). The binding sites of n-octyl-β-d-glucoside are indicated with an arrow (“β-OG”). (B) Interactions within the n-octyl-β-d-glucoside-binding pocket; the ligand and the amino acid residues are shown in stick representation, with colors corresponding to atom type. The protein’s carbon atom color corresponds to the location of the binding site (green - DII). Interactions are shown as dashed lines with the same color scheme shown in Figure 1. (C) The E protein–M protein complex. Both envelope protein chains are depicted in the solvent accessible surface representation, while the M protein is shown as a cyan ribbon (PDB id: 3J27).206
