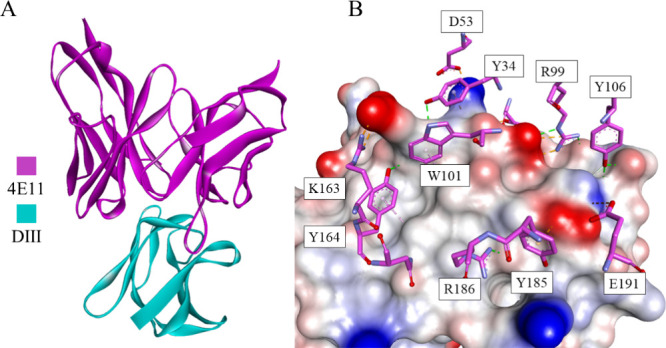
Figure 22.

(A) The 4E11 bNAb-DIII complex (DENV4) is shown in the ribbon representation, where 4E11 is colored magenta, while DIII is colored cyan. (B) A closeup showing the intermolecular interactions. DIII is shown as a solvent-accessible surface colored according to interpolated charge (red–negative, blue–positive, gray–neutral). The interacting residues are displayed as sticks colored by atom type, and the colors of the carbon atoms match that of the ribbon of the same chain. Interactions are shown as dashed lines with the same color scheme shown in Figure 1 (PDB ID: 3UYP).207
