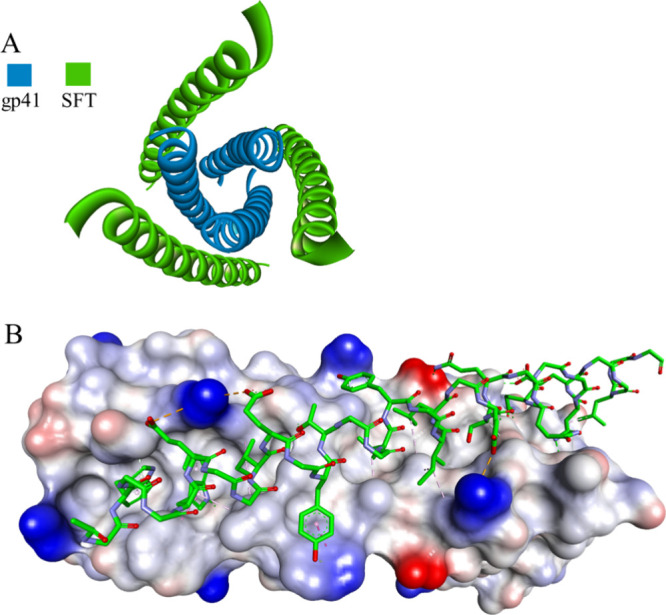
Figure 3.

Crystal structure of the SFT-gp41 complex: top (A) and side view (B) (PDB id: 3VIE). gp41 is shown as a blue ribbon or as a solvent-accessible surface colored by interpolated charge (blue–positive, gray–neutral, red–negative). The SFT peptide is shown as a green ribbon or in stick representation colored according to atom types, and noninteracting side chains are hidden for clarity. Intermolecular interactions are shown as dashed lines in the same color as in Figure 1.
