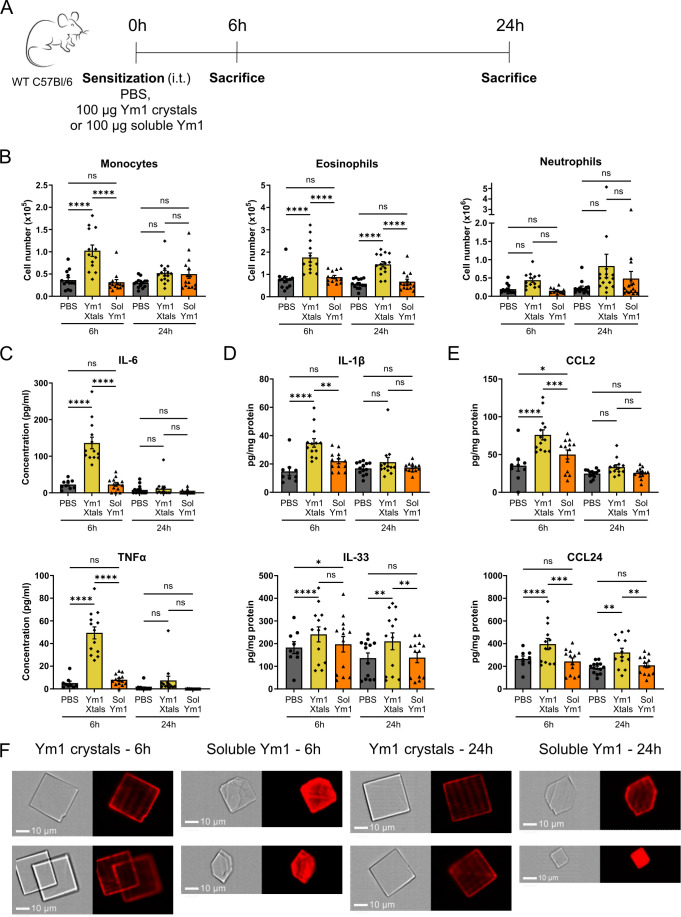
Figure 2. Ym1 crystals activate innate immunity.
(A) Scheme representing the innate immune response experiment. (B) Flow cytometric analysis of the immune cell influx in the lungs of PBS, Ym1 crystal and soluble Ym1 treated mice measured 6 and 24 hr after i.t. injection. Data are pooled from 2 (for 6 hr time point) or 3 (for 24 hr time point) independent experiments with n=13, 13, 13, 14, 15 and 15, respectively. (C) Concentration of IL-6 and TNFα in the BAL fluid measured by ELISA. (D, E) Concentration of IL-1β, IL-33 (D), CCL2 and CCL24 (E) per milligram of protein of dispersed lung tissue measured by ELISA. Data are pooled from two independent experiments with n=13 per group. Data are shown as mean ± SEM. ns p≥0.05; *p<0.05; **p<0,01; ***p<0.001; ****p<0.0001. (F) ImageStream pictures of the BAL fluid of Ym1 crystal and soluble Ym1 treated mice 6 and 24 hr after i.t. injection. Samples were stained with an antibody recognizing Ym1/2 (red).

