. 2024 Jan 9;12:RP90136. doi: 10.7554/eLife.90136

Figure 6. The NotchON L4 has correlated open chromatin, Bsh-bound loci, and transcription profile that is distinct from the NotchOFF L5.

(A) Schematic of the Targeted DamID method. Upon GAL4 induction, low levels of either Dam or Bsh:Dam are expressed, allowing genome-wide open chromatin and Bsh binding targets to be identified. (B) L4 and L5 neurons show distinct open chromatin regions (yellow), and L4-specific transcribed genes (red) are enriched in L4-distinct open chromatin regions. (C) L4 and L5 neurons show distinct Bsh-bound loci (yellow), and L4-specific transcribed genes (red) are enriched in L4-distinct Bsh-bound loci. p Values from Fisher’s exact test; odds ratios (OR) expressed as L4/L5 in all cases. (D) Model.

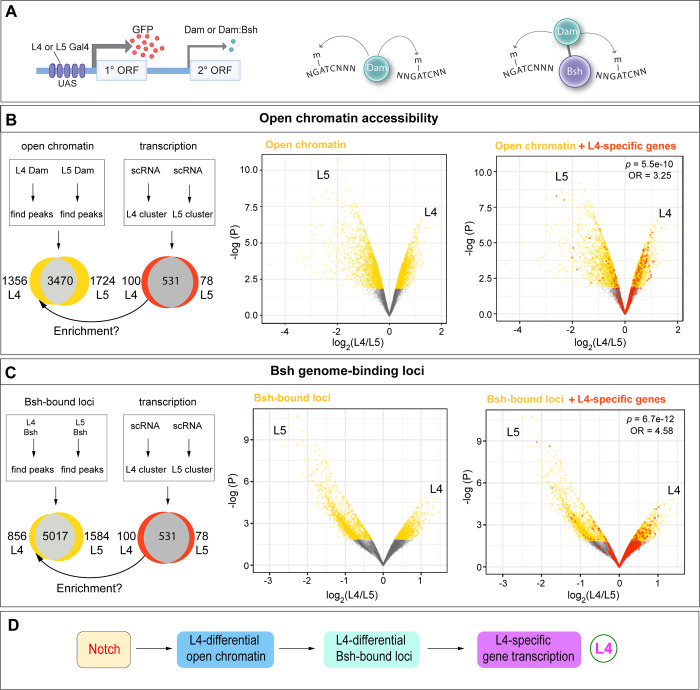
Figure 6.

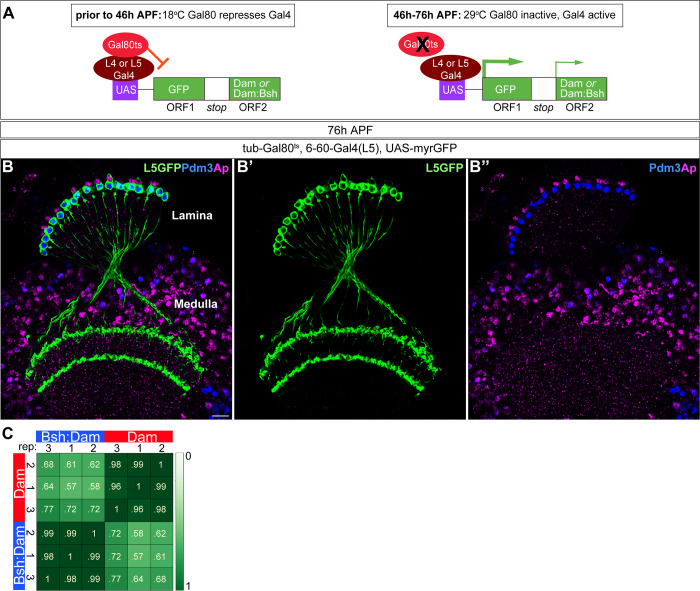
Figure 6—figure supplement 1. Six to 60 Gal4 used for TaDa experiment is specifically expressed in L5 neurons at 46 –76 hr APF.

Figure 6—figure supplement 1.

(A) Schematic of the genetics used to perform targeted Dam ID experiments (see Figure 6). (B-B”) 6–60 Gal4, which is expressed at 46–76 hr APF, drives GFP expression in all Pdm3+ L5 neurons and weak GFP expression in some Ap+ L4 neurons. Scale bar, 10 µm. n≥5 brains. (C) Both Dam and Bsh:Dam show high Pearson correlation coefficients among their three biological replicates, with lower Pearson correlation coefficients between Dam and Bsh:Dam. Heat map is generated using the multiBamSummary and plotCorrelation functions of deepTools.
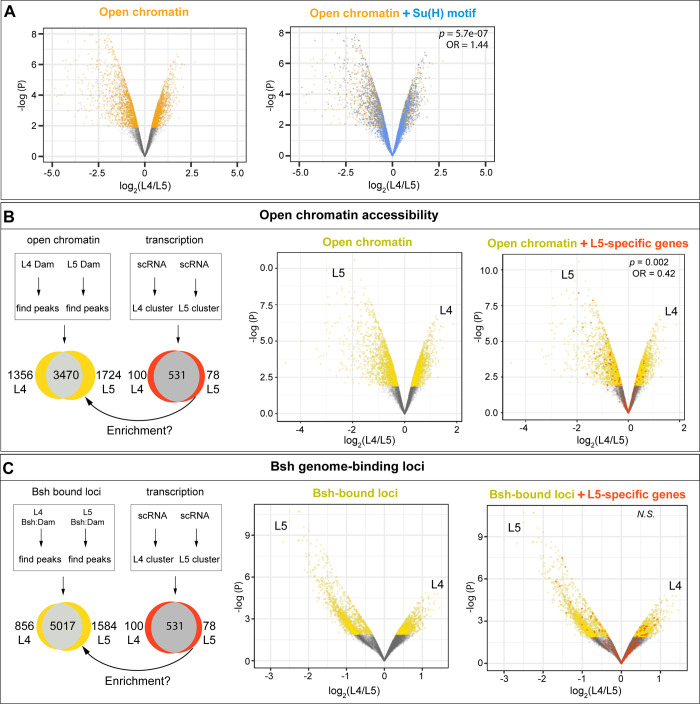
Figure 6—figure supplement 2. L4-distinct open chromatin regions are more likely to contain the Su(H) binding motif; L5-specific transcribed genes are correlated with L5-distinct open chromatin regions but not L5-distinct Bsh-bound loci.

Figure 6—figure supplement 2.

(A) L4 and L5 neurons show distinct open chromatin regions (yellow), and the Su(H) binding motif (blue) is more likely to be present in L4-distinct open chromatin regions. (B) L4 and L5 neurons show distinct open chromatin regions (yellow), and L5-specific transcribed genes (red) are enriched in L5-distinct open chromatin regions. (C) L4 and L5 neurons show distinct Bsh-bound loci (yellow); L5-specific transcribed genes (red) and L5-distinct Bsh-bound loci do not show correlation. p Values from Fisher’s exact test; odds ratios (OR) expressed as L4/L5 in all cases.