
Figure 3. BacA and BacD assemble into filamentous structures.
(A) Model of a BacA trimer generated with AlphaFold-Multimer (Evans et al., 2022). Only residues P34-D138 are shown for each subunit. (B) Visualization of BacA polymers. Purified BacA-His6 was stained with uranyl acetate and imaged by transmission electron microscopy (TEM). Arrowheads point to BacA filaments. Asterisks indicate filament bundles and sheets. Bars: 200 nm. (C) Copolymerization of BacA and BacD after heterologous co-expression in E. coli. Cells of E. coli BL21(DE3) transformed with plasmid pEC121 (PT7-bacA-eyfp PT7-bacD-ecfp) were grown in LB medium containing 5% glucose and induced with 0.5 mM isopropyl-β-D-1-thiogalactopyranoside (IPTG) prior to imaging. Shown are representative cells. Bar: 3 µm.

Figure 3—figure supplement 1. Localization patterns of BacA-YFP and BacD-CFP after heterologous overproduction in E. coli.
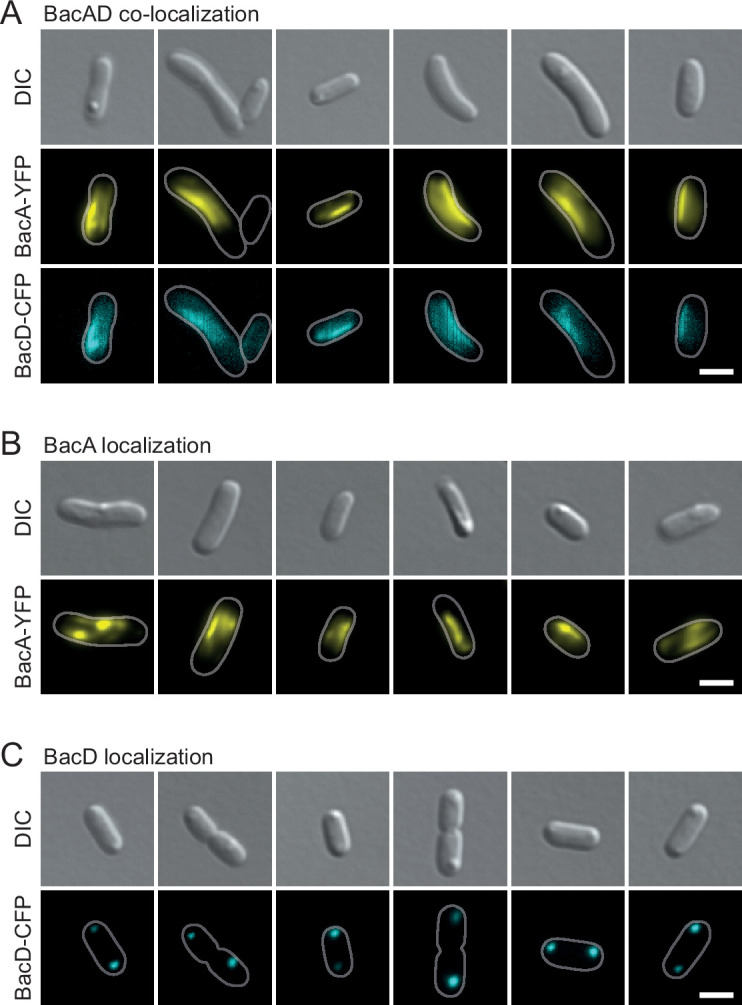
(A) Co-localization of BacA-YFP and BacD-CFP in cells of E. coli BL21(DE3) transformed with plasmid pEC121 (PT7-bacA-eyfp PT7-bacD-ecfp). (B) Localization of BacA-YFP in cells of E. coli BL21(DE3) transformed with plasmid pEC119 (PT7-bacA-eyfp) (C) Localization of BacD-CFP in E. coli BL21(DE3) transformed with plasmid pEC120 (PT7-bacD-ecfp). All strains were grown in LB medium containing 5% glucose and induced with 0.5 mM isopropyl-β-D-1-thiogalactopyranoside (IPTG) prior to imaging. The images show representative cells. Bars: 2 µm.