. 2024 Jan 31;12:RP86577. doi: 10.7554/eLife.86577

Figure 4. BacA and BacD show a dynamic, cell cycle-dependent localization pattern.

(A) Localization pattern of BacA-YFP. Cells of strain EC61 (bacA::bacA-eyfp) were transferred to agarose pads and imaged at 20 min intervals. Shown are overlays of DIC and fluorescence images of a representative cell, with YFP fluorescence shown in red. Scale bar: 3 µm. (B) Demographic analysis of BacA-YFP localization in swimmer (left), stalked (middle), and budding (right) cells of strain EC61 (bacA::bacA-eyfp). The fluorescence intensity profiles measured for cells of each type were sorted according to cell length and stacked on each other, with the shortest cell shown at the top and the longest cell shown at the bottom (n=250 swimmer cells, 215 stalked cells, and 49 budding cells). Dotted red lines indicate the positions to which cells were aligned. (C) Demographic analysis of BacD-Venus localization. Cells of strain EC67 (bacD::bacD-venus) were analyzed as described in panel B (n=416 swimmer cells, 248 stalked cells, and 45 budding cells). (D) Co-localization of BacA and BacD in cells of strain EC68 (bacA::bacA-eyfp bacD::bacD-mCherry). Shown are DIC images and overlays of the YFP and mCherry signals of representative cells, arranged according to their developmental state. The individual signals are shown in Figure 6A. The Pearson’s Correlation Coefficient (PCC) of the two fluorescence signals in a random population of cells (n=454) is 0.506. Bar: 1 µm.
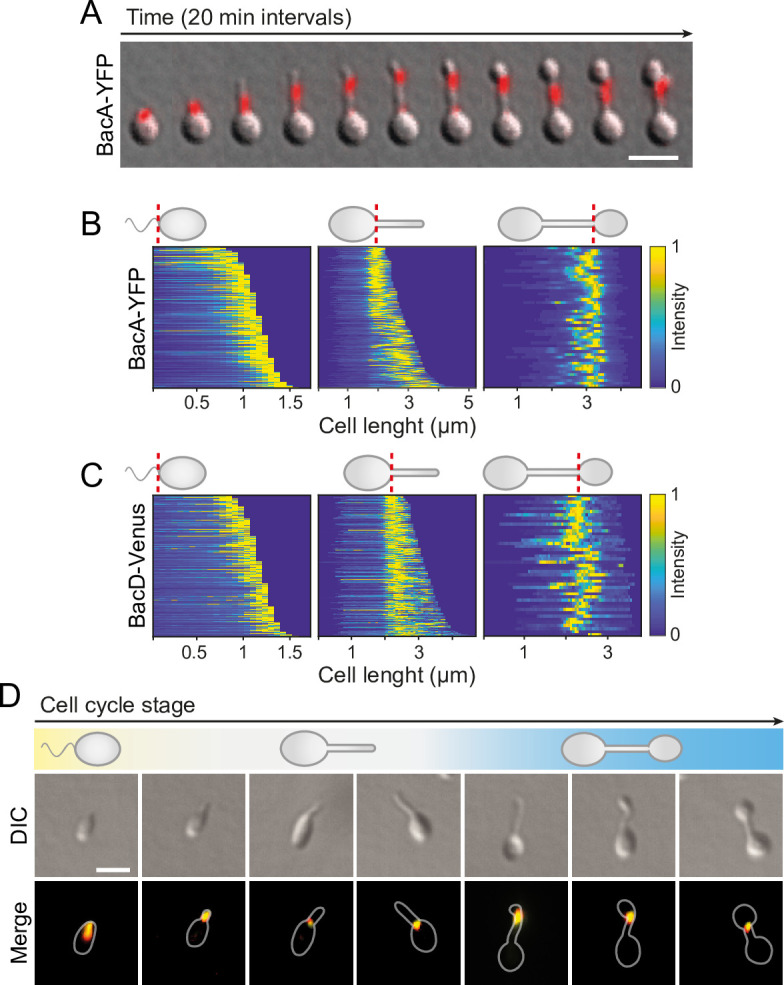
Figure 4.

Figure 4—figure supplement 1. Stability of the fluorescently tagged bactofilin derivatives used in this study.
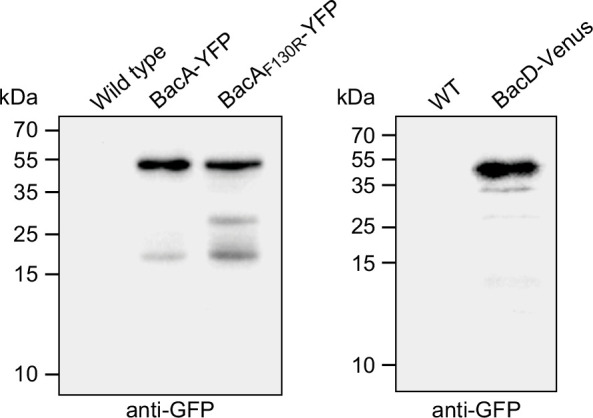
Figure 4—figure supplement 1.

Cells of strains LE670 (wild-type), EC61 (bacA::bacA-eyfp), MO78 (bacA::bacAF130R-eyfp), and EC67 (bacD::bacD-venus) were subjected to immunoblot analysis using anti-GFP antibodies.
Figure 4—figure supplement 1—source data 1. Raw images for the immunoblot analyses in Figure 4—figure supplement 1A and B.
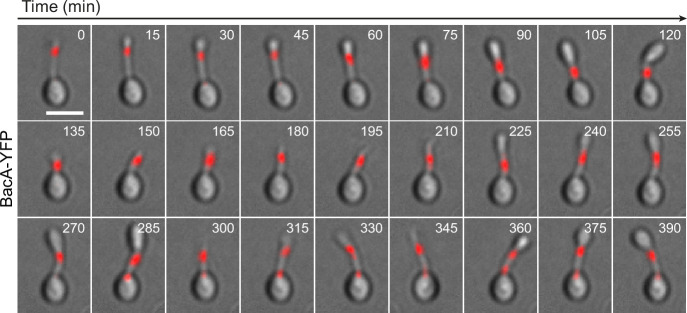
Figure 4—figure supplement 2. Localization dynamics of BacA-YFP.

Figure 4—figure supplement 2.

Cells of strain EC61 (bacA::bacA-eyfp) were flushed into a microfluidic flow cell and imaged at 15 min intervals over multiple cell cycles. Shown are overlays of DIC and fluorescence images. Bar: 2 µm.
Figure 4—figure supplement 3. Co-localization of BacA and BacD.

Figure 4—figure supplement 3.

Shown are the individual fluorescence images of strain EC68 (bacA::bacA-eyfp bacD::bacD-mCherry) used to generate the overlays in Figure 4D. Bar: 1 µm.
Figure 4—figure supplement 4. Partial independence of BacA and BacD localization at the onset of the budding process.
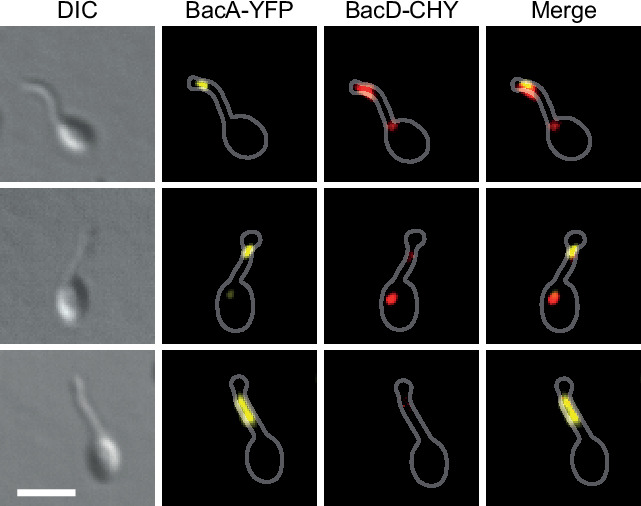
Figure 4—figure supplement 4.

Shown are exemplary cells of strain EC68 (bacA::bacA-eyfp bacD::bacD-mCherry) in which BacA-YFP and BacD-CHY do not fully co-localize. Bar: 2 µm.
Figure 4—figure supplement 5. Random localization of BacD complexes in the absence of BacA.
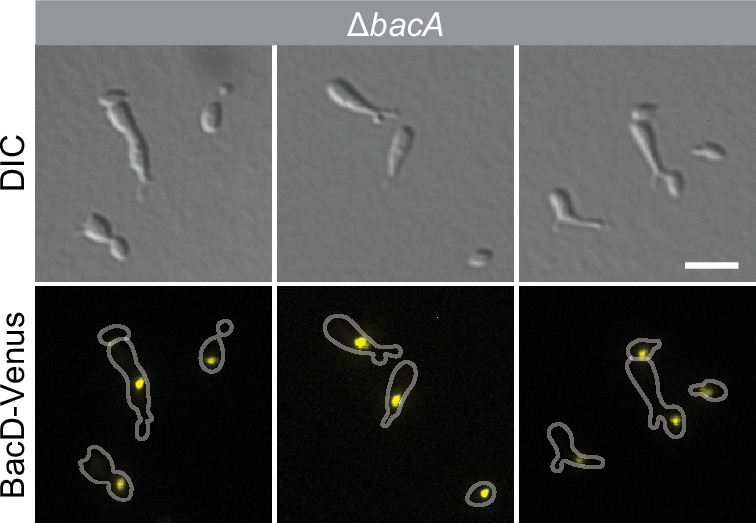
Figure 4—figure supplement 5.

Cells of strain EC60 (∆bacA PZn::PZnbacD-venus) were grown in inducer-free medium and then induced for 4 hr with 0.5 mM ZnSO4 prior to imaging. Bar: 3 µm.
Figure 4—figure supplement 6. Localization and functionality of BacAF130R-YFP.
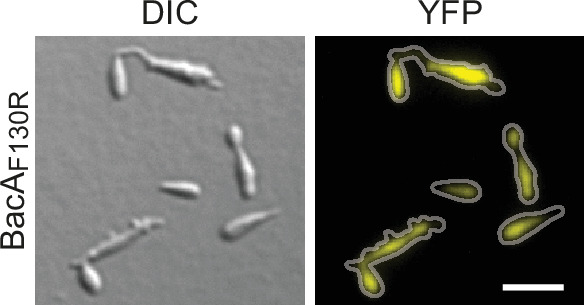
Figure 4—figure supplement 6.

Cells of strain MO78 (bacA::bacAF130R-eyfp), producing the polymerization-deficient BacAF130R-YFP variant instead of the native protein, were grown to exponential phase and imaged. Bar: 3 µm.
Figure 4—video 1. Localization dynamics of BacA-YFP (example 1).
Download video file (1.6MB, mp4)
Cells of strain EC61 (bacA::bacA-eyfp) were grown in a microfluidic flow cell and imaged at 15 min intervals. Shown are overlays of DIC and fluorescence images. YFP fluorescence is shown in red for better visibility. Bar: 2 µm.
Figure 4—video 2. Localization dynamics of BacA-YFP (example 2).
Download video file (1.2MB, mp4)
Cells of strain EC61 (bacA::bacA-eyfp) were grown in a microfluidic flow cell and imaged at 15 min intervals. Shown are overlays of DIC and fluorescence images. YFP fluorescence is shown in red for better visibility. Bar: 2 µm.
Figure 4—video 3. Localization dynamics of BacA-YFP (example 3).
Download video file (1.1MB, mp4)
Cells of strain EC61 (bacA::bacA-eyfp) were grown in a microfluidic flow cell and imaged at 15 min intervals. Shown are overlays of DIC and fluorescence images. YFP fluorescence is shown in red for better visibility. Bar: 2 µm.