Figure 2. Explicit ion modeling reproduces the energetics of nucleosomal DNA unwrapping.
(A) Illustration of the umbrella simulation setup using the end-to-end distance between two DNA termini as the collective variable. The same color scheme as in Figure 1 is adopted. Only ions close to the nucleosomes are shown for clarity. (B) Comparison between simulated (black) and experimental (red) free energy profile as a function of the unwrapped DNA base pairs. Error bars were computed as the standard deviation of three independent estimates. (C) The average number of Na+ ions within 10 Å of the nucleosomal DNA (top) and Cl−ions within 10 Å of histone proteins (bottom) are shown as a function of the unwrapped DNA base pairs. Error bars were computed as the standard deviation of three independent estimates.
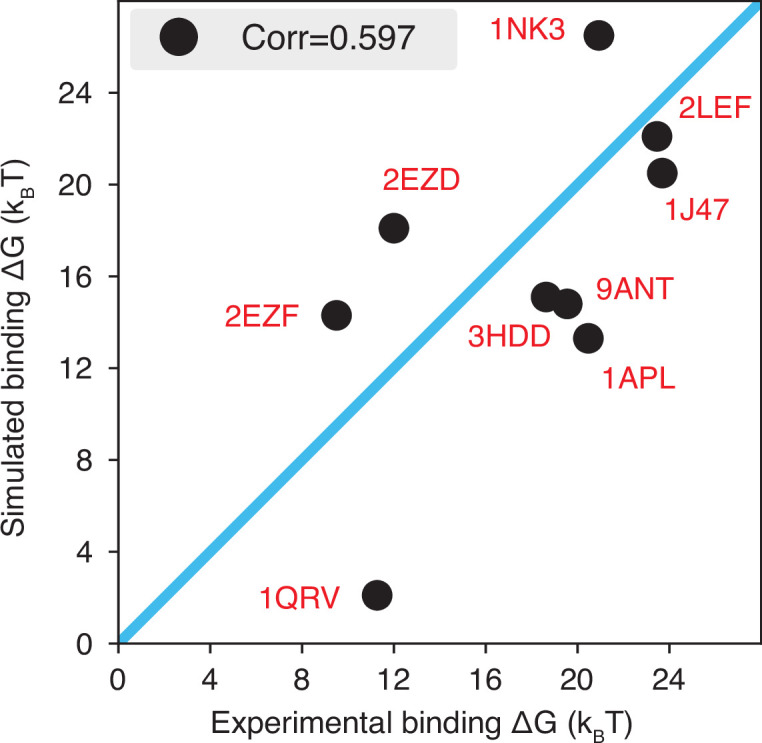
Figure 2—figure supplement 1. The explicit ion model predicts the binding affinities of protein-DNA complexes well, related to Figure 1 of the main text.


