Figure 4. Close contacts give rise to strong inter-nucleosomal interactions.
(A) Illustration of the simulation protocol employed to mimic the nucleosome unbinding pathway dictated by the DNA-origami device (Funke et al., 2016). The three configurations, A1, A2, and A3, corresponding to the three cyan dots in part B at distances 62.7, 80.2, and 96.3 Å. For comparison, a tightly bound configuration uncovered in simulations without any restraints of nucleosome movement is shown as A1’. The number of contacts formed by histone tails and DNA (Htail-DNA) and by histone core and DNA (Hcore-DNA) from different nucleosomes is shown for A1 and A1’. (B) Free energy profile as a function of the distance between the geometric centers of the two nucleosomes, computed from unrestrained (black) and DNA-origami-restrained simulations (red). Error bars were computed as the standard deviation of three independent estimates. (C) Average inter-nucleosomal contacts between DNA and histone tail (orange) and core (blue) residues, computed from unrestrained and DNA-origami-restrained simulations. Error bars were computed as the standard deviation of three independent estimates.

Figure 4—figure supplement 1. Illustration of the restrained two nucleosome simulations setup, related to Figure 4 of the main text.

Figure 4—figure supplement 2. Explicit ion modeling reproduces the experimental free energy profiles of nucleosome binding.

Figure 4—figure supplement 3. Compared with DNA-origami-restrained simulations, the unrestrained simulations produce more histone-DNA contacts across nucleosomes, related to Figure 4 of the main text.

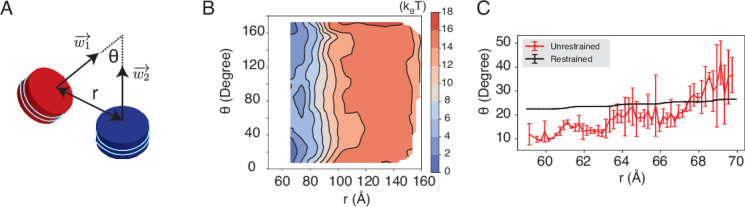
Figure 4—figure supplement 4. The unrestricted simulations favor a smaller angle between two nucleosomal planes compared to the DNA-origami-restrained simulations, related to Figure 4 of the main text.