. 2024 Jan 30;12:RP90073. doi: 10.7554/eLife.90073

Figure 5. Simulations predict significant inter-nucleosome interactions at physiological conditions.

(A) Illustration of the collective variable, θ, defined as the angle between two nucleosomal planes, and r defined as the distance between the nucleosome geometric centers. w1 and w2 represent the axes perpendicular to the nucleosomal planes. (B) The 2D binding free energy profile as a function of θ and r at the physiological salt condition (150 mM NaCl and 2 mM MgCl2) for nucleosomes with the 601 sequence. (C) Dependence of nucleosome binding free energy on nucleosome repeat length (NRL) and linker histone H1.0. Error bars were computed as the standard deviation of three independent estimates. (D) Representative structure showing linker histones (red and blue) mediating inter-nucleosomal contacts.

Figure 5.

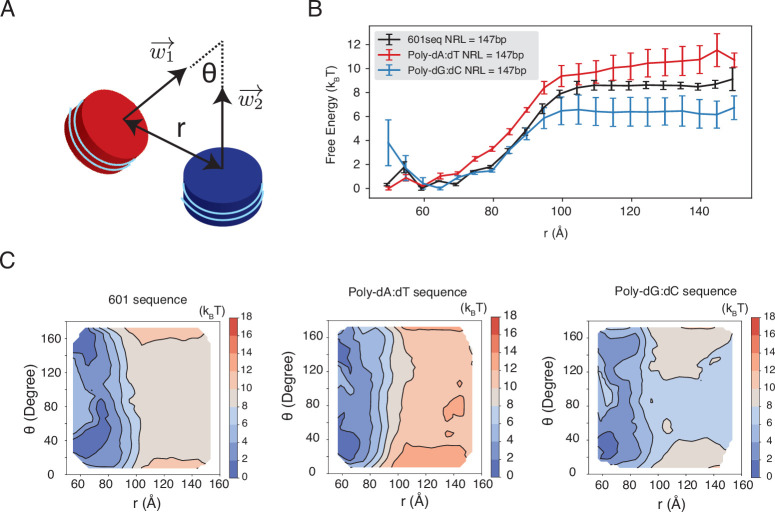
Figure 5—figure supplement 1. Dependence of inter-nucleosome interactions on the DNA sequence, related to Figure 5 of the main text.

Figure 5—figure supplement 1.

See text section ‘Simulations at the physiological salt concentration’ for further discussions on simulation details. (A) Illustration of the collective variables used in umbrella-sampling simulations. θ is the angle between two nucleosomal planes, and r is the distance between the geometric centers of two nucleosomes. w1 and w2 represent the vectors perpendicular to the nucleosome planes. (B) The free energy profile as a function of the distance r between the geometric centers of two nucleosomes with 601, poly-dA:dT, and poly-dG:dC sequences. Error bars were computed as the standard deviation of three independent estimates. (C) The 2D free energy profiles as a function of θ and r. The simulations used nucleosomes with 601, poly-dA:dT, and poly-dG:dC sequences.
Figure 5—figure supplement 2. The poly-dA:dT sequence produces a higher number of cross-nucleosome histone-DNA contacts compared to the poly-dG:dC sequence, related to Figure 5 of the main text.
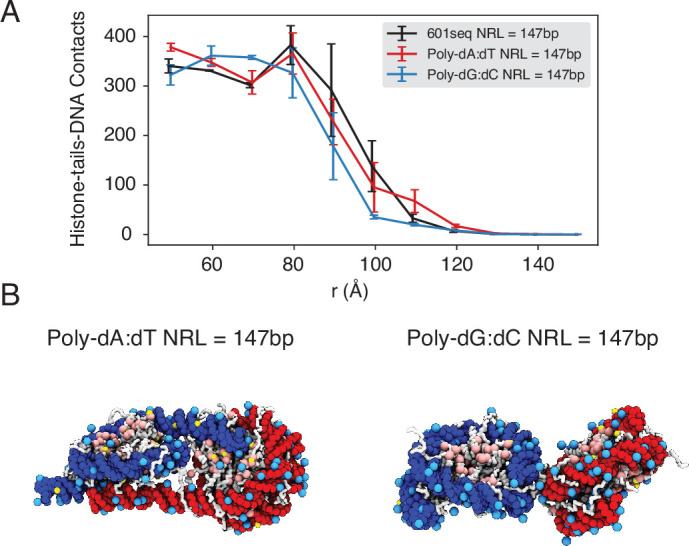
Figure 5—figure supplement 2.

(A) The average number of inter-nucleosome contacts between histone proteins and nucleosomal DNA is plotted as a function of the distance r between the geometric centers of two nucleosomes. The error bars were estimated as the standard deviation of three equal partitions of the simulations. (B) Representative structures from simulations with poly-dA:dT (left) and poly-dG:dC (right) nucleosomes. Noticeable DNA unwrapping can be seen in poly-dA:dT nucleosomes, contributing to the increased cross-nucleosome contacts.
Figure 5—figure supplement 3. Free energy profiles for the interactions between a pair of nucleosomes at different nucleosome repeat lengths (NRL) and in the presence of the linker histone H1.0, related to Figure 5 of the main text.
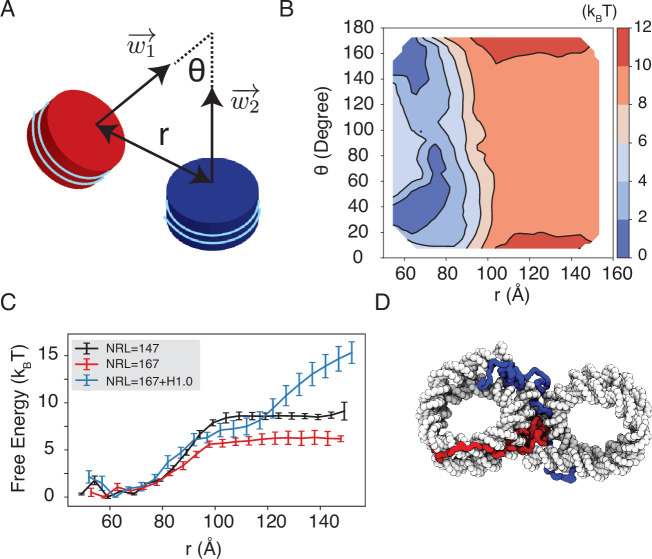
Figure 5—figure supplement 3.

See text section ‘Simulations at the physiological salt concentration’ for further discussions on simulation details. (A) Illustration of the collective variables used in the umbrella-sampling simulations. θ is the angle between two nucleosome planes, and r is the distance between the geometric centers of two nucleosomes. w1 and w2 represent the vectors perpendicular to the nucleosome planes. (B) 2D free energy profiles as a function of θ and r for the three systems indicated in the titles.