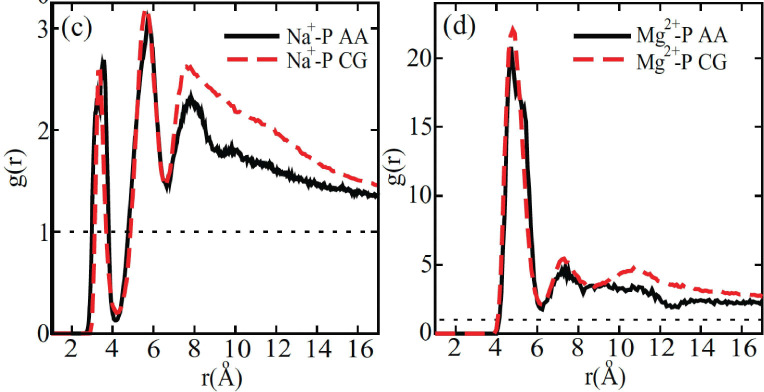
Author response image 1. Comparison between the radial distribution functions of Na+ (left) and Mg2+ (right) ions around the DNA phosphate groups computed from all-atom (black) and coarse-grained (red) simulations.
Figure reproduced from Figure 4 of [1]. The coarse-grained explicit ion model used in producing the red curves is identical to the one presented in the current manuscript.
© 2011, AIP Publishing
This figure is reproduced with permission from Figure 4 in Freeman GS, Hinckley DM, de Pablo JJ (2011) A coarse-grain three-site-pernucleotide model for DNA with explicit ions. The Journal of Chemical Physics 135:165104. It is not covered by the CC-BY 4.0 license and further reproduction of this figure would need permission from the copyright holder.

