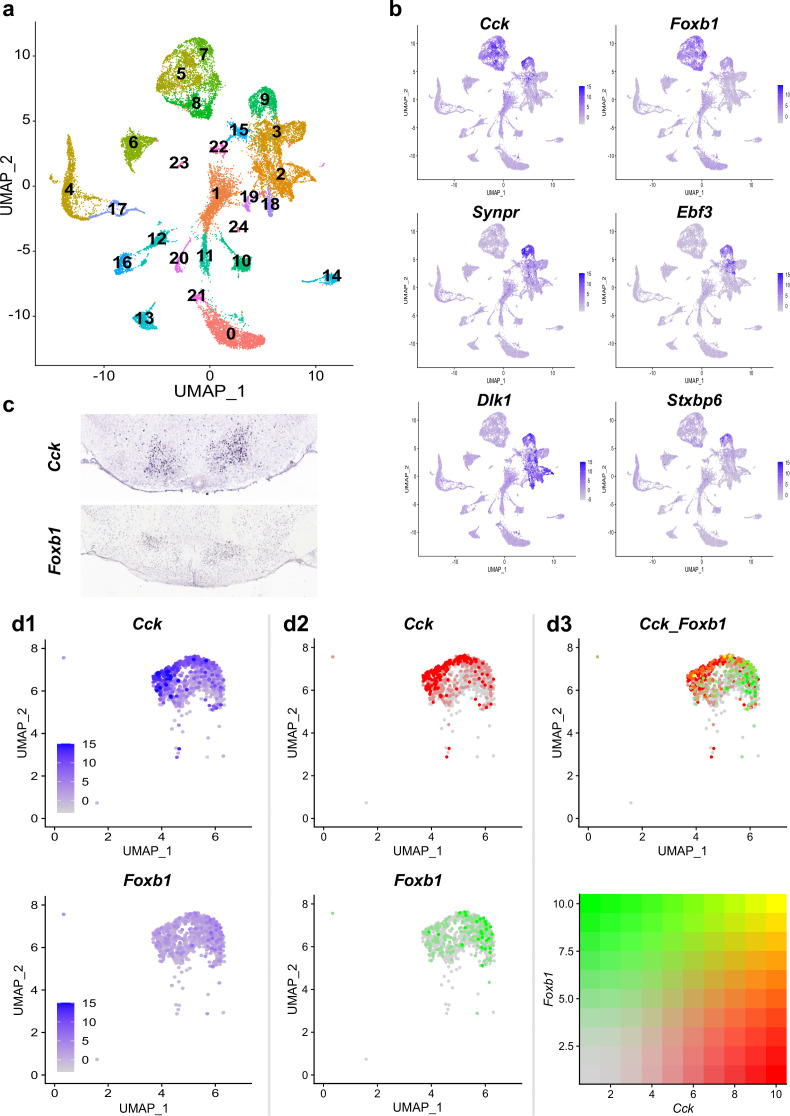
Figure 4. Single-cell RNA sequencing reveals differential expression profiles of Foxb1 and Cck in the PMd.
(a) Single-cell transcriptomic analysis of murine ventral-posterior hypothalamic PMd cells into a distinct cluster (Cluster 9). (b) Cluster identity of the PMd cluster is confirmed by expression pattern analysis of genes known to be upregulated in the PMd (Cck, Foxb1, Synpr, Ebf3, Dlk1, and Stxpb6). (c) In situ hybridization photomicrographs from the Allen Brain Atlas show the localization of Cck and Foxb1 transcripts in the PMd. (d) A magnified UMAP plot representation of the PMd cluster highlights the differential expression profiles of Cck and Foxb1 within the PMd cluster. While cells expressing high transcript levels of Cck (middle column, red) preferentially localize to the left side of the PMd cluster, cells with high levels of Foxb1 transcripts (middle column, green) preferentially localize to the opposite (i.e. right) side of the PMd cluster. Analysis of co-expression of Cck and Foxb1 transcripts identifies only few cells as strongly double positive (yellow; see color coding representation), while most cells with high expression levels for one of the two genes have very low to non-existing expression levels of the other gene.


