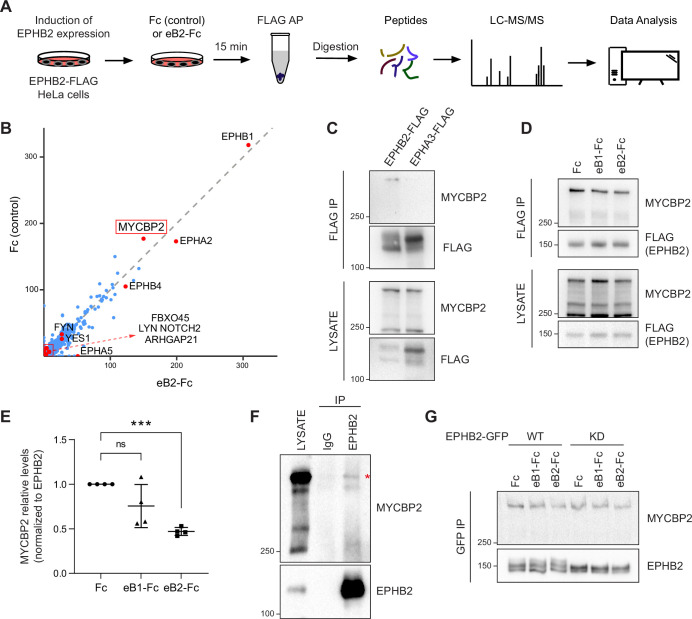
Figure 1. MS-proteomics and biochemistry in HeLa cells identifies MYCBP2 as EPHB2 binding protein.
(A) Schematic of EPHB2 affinity purification coupled to mass spectrometry (AP-MS) workflow. (B) Scatter plot of AP-MS data showing known and putative EPHB2 binding proteins, including MYCBP2. Y and X axes represent the average spectral counts of the identified protein hits in the EPHB2 protein complexes from cells stimulated with Fc control or ephrin-B2 (eB2-Fc), respectively. (C) In HEK 293T cells, endogenous MYCBP2 is pulled down by transiently overexpressed EPHB2-FLAG but not by EPHA3-FLAG. (D) In EPHB2-FLAG stable HeLa cell line, ephrin-B stimulation reduces the interaction between MYCBP2 and EPHB2. (E) Quantification of MYCBP2-EPHB2 association intensity after Fc, ephrin-B1 (eB1-Fc) or ephrin-B2 (eB2-Fc) treatment (eB1-Fc, p=0.1365; eB2-Fc, p=0.0002; one-sample t-test). EPHB2-MYCBP2 interaction reduction evoked by eB1-Fc is not statistically significant, probably because of high experimental variability which could be biologically significant. Error bars represent standard deviation (SD). (F) Representative image of MYCBP2 pull down with anti-EPHB2 or IgG control antibodies from rat cortical neurons. Asterisk indicates MYCBP2. (G) Representative images from western blot analysis of endogenous MYCBP2 following IP of GFP-EPHB2 wild-type (WT) or its kinase dead (KD) counterpart.

