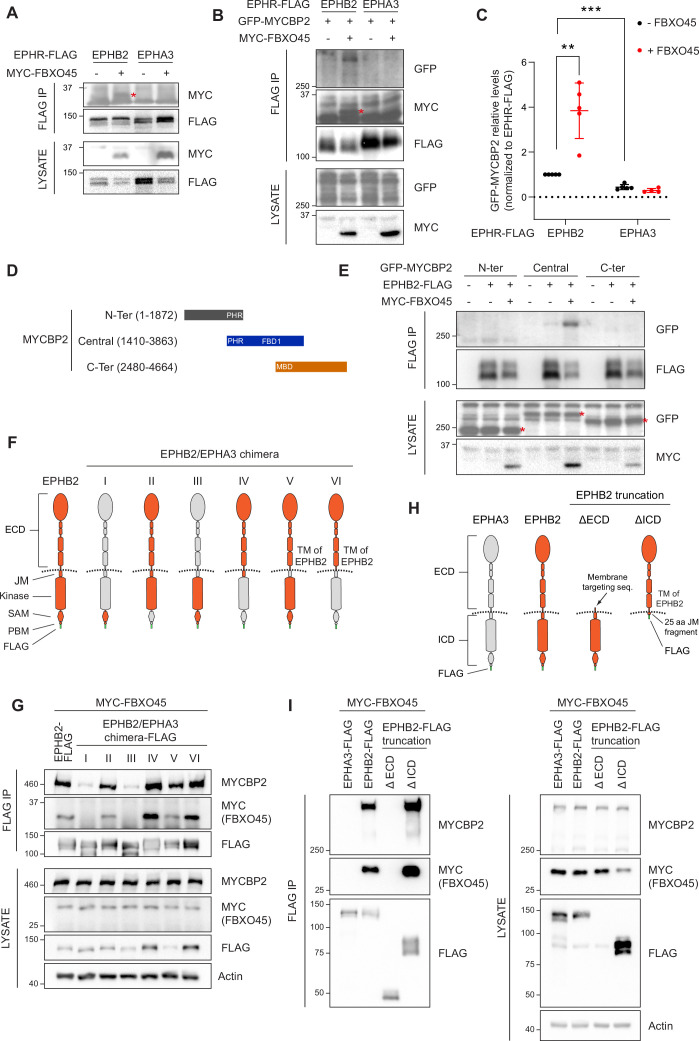
Figure 2. Mapping binding regions for EPHB2-MYCBP2 reveals role of FBXO45 in this interaction.
(A) Co-IP of EPHB2-FLAG with MYC-FBXO45 using transfected HEK293 cells. EPHB2 co-precipitates FBXO45, but EPHA3 does not. Asterisk indicates MYC-FBXO45. (B) In HEK 293T cells, FBXO45 overexpression enhances EPHB2-MYCBP2 binding. Asterisk indicates MYC-FBXO45. (C) Quantification of the association intensity of MYCBP2 and EPHB2 upon FBXO45 overexpression (EPHB2, p=0.0068; EPHB2 vs EPHA3, p=0.0005; one sample t-test). Error bars represent SD. (D) Schematic representation of MYCBP2 N-terminal, Central, and C-terminal fragments. (E) Co-IP of EPHB2-FLAG with GFP-MYCBP2 fragments in HEK 293T cells. EPHB2 coprecipitates with MYCBP2 central fragment. Asterisks indicate GFP-MYCBP2 fragments. (F) Schematic of chimeric domain swapping of EPHB2 (orange) and EPHA3 (grey). (G) Co-IP of MYC-FBXO45 and endogenous MYCBP2 with EPHB2/EPHA3 domain swapped chimeras. (H) Schematic representation of EPHB2 ΔECD (extracellular domain, aa deletions of 19–530) and ΔICD (intracellular domain, aa deletions of 590–986) truncations. (I) Co-IP of endogenous MYCBP2 with EPHA3, EPHB2 and EPHB2 truncation mutants. ECD, extracellular domain; TM, transmembrane; JM, juxtamembrane; SAM, Sterile alpha motif; PBM, PDZ (PSD-95, Dlg1, Zo-1) binding motif.

