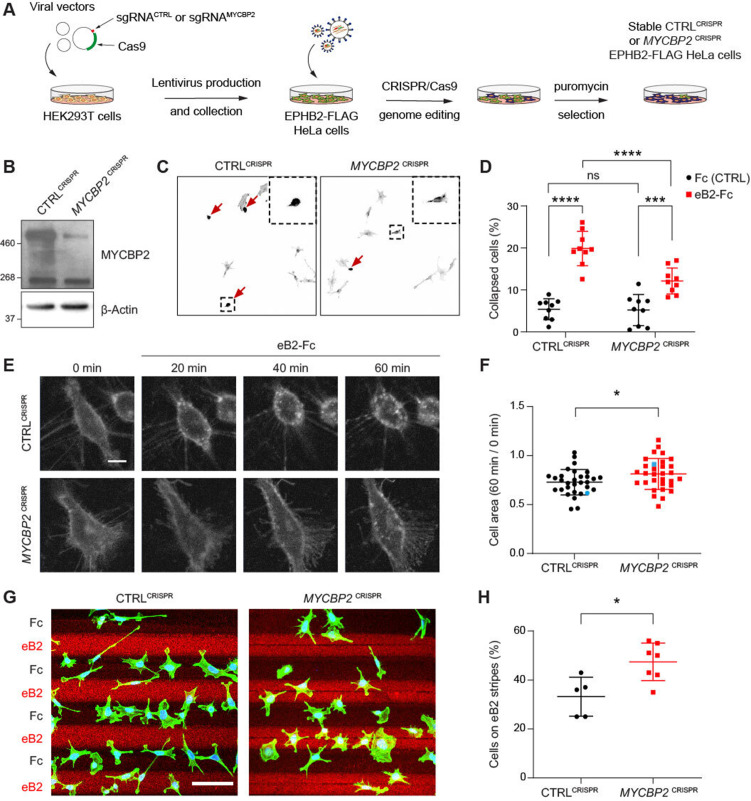
Figure 3. MYCBP2 CRISPR HeLa cells exhibit reduced ephrin-B2 evoked cell retraction and ephrin-B2 stripe avoidance.
(A) Schematic of generation of stable CTRLCRISPR or MYCBP2CRISPR HeLa EPHB2-FLAG cells. Note that these are not clonal cell lines. (B) MYCBP2 is reduced in HeLa MYCBP2CRISPR cells generated by sgRNA targeting MYCBP2 exon 6. (C) Representative images of cell collapse assays using CTRLCRISPR or MYCBP2CRISPR HeLa cells that were stimulated with ephrin-B2. Red arrows indicate rounded/collapsed cells. Scale bar is 10 μm, (D) Quantification of collapsed cells. Statistical significance between CTRLCRISPR and MYCBP2CRISPR cells was determined using two-way ANOVA followed by Sidak’s multiple comparison test (CTRLCRISPR vs MYCBP2 CRISPR: Fc, p=0.9903; eB2-Fc, p<0.0001. Fc vs eB2-Fc: CTRLCRISPR, p<0.0001; MYCBP2 CRISPR, p=0.0003). (E) Representative time-lapse sequences of CTRLCRISPR and MYCBP2CRISPR HeLa cells after ephrin-B2 treatment. (F) Quantification of cell area reduction after 60 min exposure to ephrin-B2. Cell area contraction ratio: CTRLCRISPR, 27.1%; MYCBP2CRISPR, 18.8%. p=0.0268, two-tailed unpaired t test. Data points corresponding to cells in representative images in panel E are in blue. (G) Ephrin-B2 stripe assays using CTRLCRISPR or MYCBP2CRISPR HeLa cells. Cells are visualized with Phalloidin 488 staining and nuclei are stained with DAPI (black, Fc stripes; red, ephrin-B2 stripes). Scale bar is 50 μm. (H) Quantification of cells present on ephrin-B2 stripes (%). Statistical significance was determined using two-tailed unpaired t-test (p=0.0109). Error bars represent SD.

