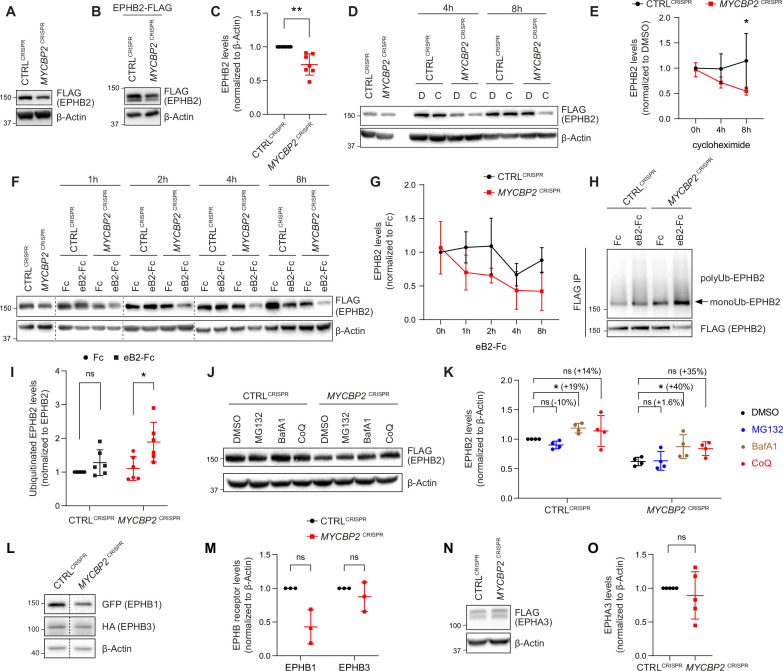
Figure 4. MYCBP2 loss-of-function increases EPHB2 protein turnover in HeLa cells.
(A) Induced EPHB2-FLAG expression is reduced in MYCBP2CRISPR HeLa cells. (B) Western blotting for transfected EPHB2-FLAG in CTRLCRISPR and MYCBP2CRISPR cells. (C) Quantification of transfected EPHB2-FLAG levels (p=0.0046, one-sample t-test). (D) Representative western blot of EPHB2-FLAG in CTRLCRISPR and MYCBP2CRISPR cells treated with DMSO or cycloheximide for 4 hr and 8 hr. (E) Quantification of EPHB2-FLAG turnover with cycloheximide (CTRLCRISPR vs. MYCBP2CRISPR at 8 hr eB2-Fc stimulation, p=0.0474, two-way ANOVA followed by Tukey’s multiple comparison test). (F) Western blot showing EPHB2-FLAG degradation when cells are challenged with ephrin-B2 (1 µg/ml) for different periods of time. (G) Quantification of ephrin-B2-evoked EPHB2 degradation (ns, not significant; two-way ANOVA followed by Tukey’s multiple comparison test). Although not significant, there is an apparent trend towards lower EPHB2 levels in MYCBP2CRISPR cells, which could become significant with additional replicates. (H) Western blot of EPHB2 ubiquitination in CTRLCRISPR and MYCBP2CRISPR cells. (I) Quantification of ubiquitinated EPHB2. CTRLCRISPR cells stimulated with Fc vs. eB2-Fc, p=0.1349 (One sample t-test); MYCBP2CRISPR cells stimulated with Fc vs. EB2-Fc, p=0.0195 (Unpaired two-tailed t-test). (J) After tetracycline induction of EPHB2-FLAG expression for 16 hr, CTRLCRISPR and MYCBP2CRISPR HeLa cells were treated with DMSO (1:500) or inhibitors of the proteasome (MG132 50 µM) or lysosome (BafA1 0.2 µM; CoQ 50 µM) for 6 hr, and EPHB2 levels were analysed by western blotting. (K) Quantification of EPHB2 levels following treatment with proteasome or lysosome inhibitors. Statistical significance for the comparison between CTRLCRISPR cells treated with DMSO or inhibitors was determined by one-sample t-test (MG132, p=0.0598; BafA1, p=0.0200; CoQ, p=0.3632), whereas statistical significance for the comparison between MYCBP2CRISPR cells treated with DMSO and individual inhibitors was determined by two-tailed paired t-test (MG132, p=0.8893; BafA1, p=0.0361; CoQ, p=0.0835). (L) GFP-EPHB1 and HA-EPHB3 transfected into CTRLCRISPR and MYCBP2CRISPR HeLa cells and detected by western blot. (M) Quantification of GFP-EPHB1 and HA-EPHB3 levels (EPHB1, p=0.0588; EPHB3, p=0.4253; one-sample t-test). (N) FLAG-EPHA3 transfected into CTRLCRISPR and MYCBP2CRISPR HeLa cells and detected by WB. (O) Quantification of FLAG-EPHA3 (p=0.5369, one-sample t-test). Error bars represent SD.

