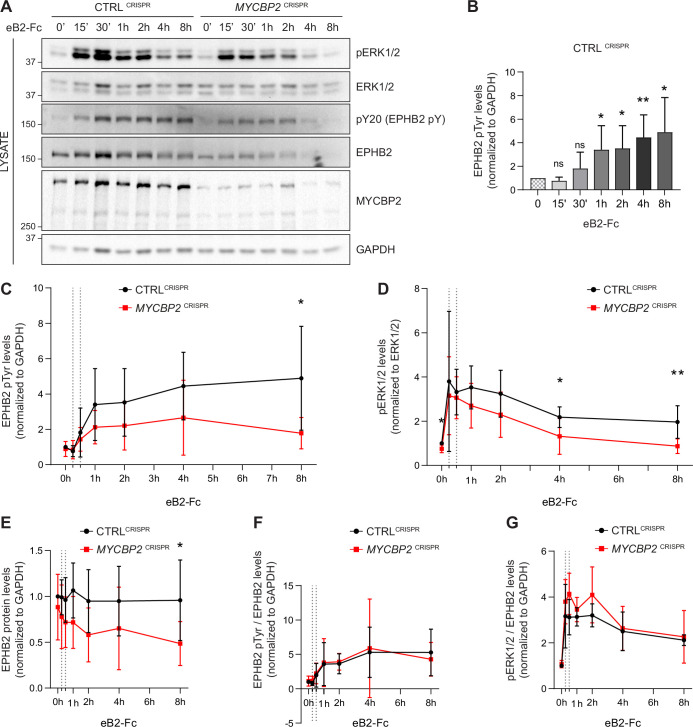
Figure 5. MYCBP2 depletion impairs EPHB2 phosphorylation and ERK1/2 activation in HeLa cells.
(A) Representative western blot for pERK1/2 and pTyr-EPHB2 detected in CTRLCRISPR and MYCBP2CRISPR cells treated with ephrin-B2 (eB2-Fc) for different periods (n=6). Membranes were striped and reblotted with anti-ERK1/2, anti-EPHB2, anti-GAPDH and anti-MYCBP2 antibodies as controls. (B) Quantification of EPHB2 tyrosine phosphorylation in CTRLCRISPR cells evoked by ephrin-B2 treatment (15 min, P=0.1363; 30 min, P=0.2056; 1 h, P=0.0342; 2 h, P=0.0234; 4 h, P=0.0068; 8 h, P=0.0231; one-sample t-test). (C) Quantification of EPHB2 tyrosine phosphorylation in CTRLCRISPR and MYCBP2CRISPR HeLa cells (unstimulated, P=0.5589, one-sample t-test; stimulated for 15 min, P=0.7463; 30 min, P=0.5520; 1 h, P=0.1920; 2 h, P=0.2009; 4 h, P=0.1550; 8 h, P=0.0331; two-tailed unpaired t-test). (D) Quantification of pERK1/2 in CTRLCRISPR and MYCBP2CRISPR HeLa cells (0 min, P=0.0168, one-sample t-test; 15 min, P=0.6695; 30 min, P=0.6649; 1 h, P=0.1776; 2 h, P=0.1479; 4 h, P=0.0494; 8 h, P=0.0078; two-tailed unpaired t-test). (E) Quantification of EPHB2 in CTRLCRISPR and MYCBP2CRISPR HeLa (0 min, P=0.4604, one-sample t-test; 15 min, P=0.2222; 30 min, P=0.1376; 1 h, P=0.0651; 2 h, P=0.0736; 4 h, P=0.2451; 8 h, P=0.0437, two-tailed unpaired t-test). (F) Quantification of ephrin-B2-evoked EPHB2 tyrosine phosphorylation levels relative to total EPHB2 protein levels (0 min, P=0.7058, one-sample t-test; 15 min, P=0.2464; 30 min, P=0.7835; 1 h, P=0.9164; 2 h, P=0.7196; 4 h, P=0.8625; 8 h, P=0.5750, two-tailed unpaired t-test). (G) Quantification of ephrin-B2-evoked pERK1/2 relative to EPHB2 total protein levels 0 min, P=0.3308, one-sample t-test; 15 min, P=0.3856; 30 min, P=0.0624; 1 h, P=0.2683; 2 h, P=0.1284; 4 h, P=0.7998; 8 h, P=0.7790, two-tailed unpaired t-test. Error bars represent SD.

