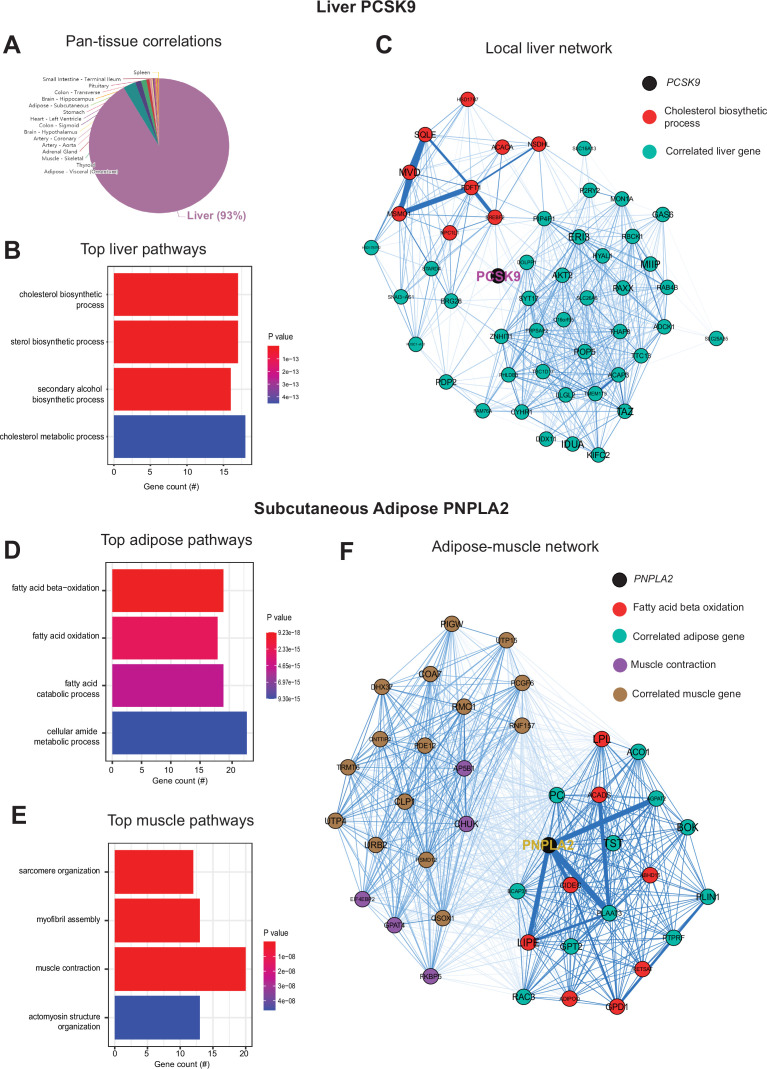
Figure 3. Inter-individual transcript correlation structure and network architecture of liver PCSK9 and adipose PNPLA2.
(A) Distribution of pan-tissue genes correlated with liver PCSK9 expression (q<0.1), where 93% of genes were within liver (purple). (B) Gene ontology (GO) (BP) overrepresentation test for the top 500 hepatic genes correlated with PCSK9 expression in liver. (C) Undirected network constructed from liver genes (aqua) correlated with PCSK9, where those annotated for ‘cholesterol biosynthetic process’ are colored in red. (D–E) Overrepresentation tests corresponding to the top-correlated genes with adipose (subcutaneous) PNPLA2 expression residing in adipose (D) or peripherally in skeletal muscle (E). (F) Undirected network constructed from the strongest correlated subcutaneous adipose tissue (light aqua) and muscle genes (light brown) with PNPLA2 (black), where genes corresponding to GO terms annotated as ‘fatty acid beta oxidation’ or ‘muscle contraction’ are colored purple or red, respectively. For these analyses all 310 individuals (across both sexes) were used and q-value adjustments calculated using a Benjamini-Hochberg FDR adjustment. Network graphs generated based in biweight midcorrelation coefficients, where edges are colored blue for positive correlations or red for negative correlations. Network edges represent positive (blue) and negative (red) correlations and the thicknesses are determined by coefficients. They are set for a range of bicor=0.6 (minimum to include) to bicor=0.99.

