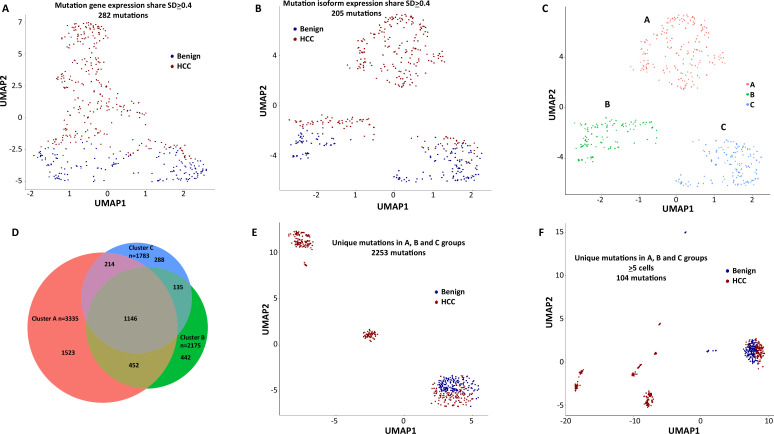
Figure 3. Mutation expression clustering of cells from hepatocellular carcinoma (HCC) and its benign liver counterpart.
(A) Uniform Manifold Approximation and Projection (UMAP) clustering of cells from the HCC and benign liver, based on mutational gene expressions shares with standard deviations ≥ 0.4. Red cells are from HCC; Blue cells are from benign liver. (B) UMAP clustering of cells from the HCC and benign liver based on mutational isoform expression shares with standard deviations ≥ 0.4. (C) Relabeling of clusters from (B) as ‘A’, ‘B’, and ‘C’. (D) Venn diagram of mutational isoform expressions in cells from clusters A, B, and C. (E) UMAP clustering of cells from the HCC and benign liver based on the mutational isoform expressions from clusters A, B, and C. (F) UMAP clustering of cells from the HCC and benign liver based on the mutational isoform expression in at least five cells from clusters A, B, and C.


