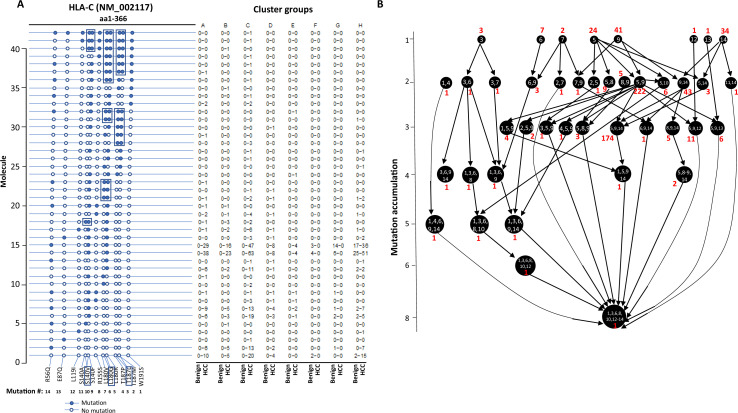
Figure 7. Evolution of mutations in HLA-C molecules.
(A) Somatic mutations in single molecules of HLA-C NM_002117. The position of the mutation is indicated at the bottom of the graph. The mutation is numerically numbered from C-terminus to N-terminus. The numbers of cells expressing these mutation transcripts from each cluster or sample are indicated in the right panel. Close circle, mutation codon; open circle, wild-type codon; open rectangle, double single-nucleotide mutation in the same codon. (B) Pathway flowchart of mutation accumulation in single molecules of HLA-C. The area of the circle is proportional to the accumulated number of mutations in a molecule. The scale on the left indicates the number of mutations in a single molecule but is not mathematically scaled. The arrow indicates the potential pathways of mutation accumulation in these molecules. The number in white text indicates specific mutation(s) in a molecule. The number in red text indicates the number of cells expressing the mutation(s).

