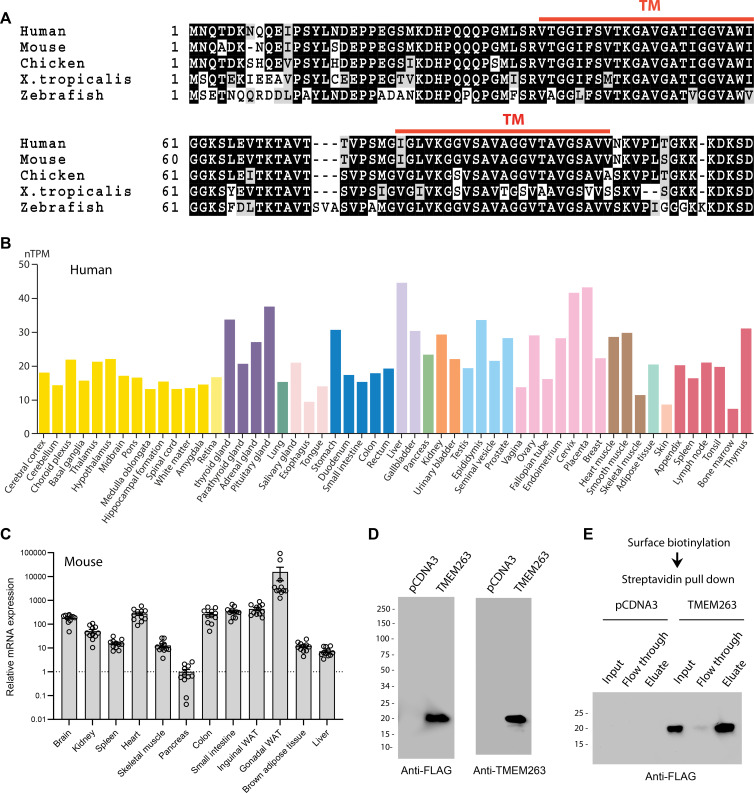
(A) Sequence alignment of full-length human (NP_689474), mouse (NP_001013046), chicken (NP_001006244), Xenopus frog (NP_989399), and zebrafish (NP_998306) transmembrane protein 263 (TMEM263) using Clustal-omega (Sievers and Higgins, 2018). Identical amino acids are shaded black and similar amino acids are shaded gray. Gaps are indicated by dash lines. The two predicted transmembrane domains are indicated in red. (B) TMEM263 expression across normal human tissues based on the consensus Human Protein Atlas (HPA) and Gene-Tissue Expression (GTEx) datasets. The data can be accessed via the HPA database (https://www.proteinatlas.org). nTPM denotes normalized protein-coding transcripts per million and it corresponds to the mean values of the different individual samples from each tissue. Bars are color-coded based on tissue groups with functional features in common. (C) Tmem263 expression across mouse tissues (n=11). Relative expression across tissues were first normalized to β-actin, then normalize to the tissue (pancreas) with the lowest expression. (D) Immunoblot analysis of cell lysate from HEK293 cells transfected with a control pCDNA3 empty plasmid or plasmid encoding human TMEM263 tagged with a C-terminal Myc-DDK epitope. Immunoblots were probed with an anti-FLAG (DDK) antibody (left panel) or an anti-TMEM263 antibody (right panel). (E) TMEM263 is localized to the plasma membrane. Surface biotinylation was carried out on transfected HEK293 cells. Biotinylated plasma membrane proteins were captured with Avidin-agarose beads, eluted, and immunoblotted for TMEM263 with an anti-FLAG antibody.
Figure 1—source data 1. Top left – Original uncropped membrane from imager showing blue channel only as a black and white image.Two close molecular markers are noted. FLAG-tagged TMEM263 at the predicted molecular weight is marked. The cropped region used for the main figure image is marked with a dotted box. This membrane was probed with the anti-FLAG antibody. Bottom left – The same membrane as shown above, but overexposed and imaged with the light channel to show the entire membrane outline. The anti-FLAG antibody is very clean and therefore the membrane boarder is hard to see otherwise. Top right – Original uncropped membrane from imager showing blue channel only as a black and white image. Two close molecular markers are noted. FLAG-tagged TMEM263 at the predicted molecular weight is marked. The cropped region used for the main figure image is marked with a dotted box. This membrane was probed with the anti-FLAG antibody. Bottom left – The same membrane as shown above, but overexposed and imaged with the light channel to show the entire membrane outline. The anti-TMEM263 antibody is fairly clean and therefore the membrane boarder is hard to see otherwise.
Figure 1—source data 2. Left – Original uncropped membrane from imager showing blue channel only as a black and white image.Two close molecular markers are noted. FLAG-tagged TMEM263 at the predicted molecular weight is marked. The cropped region used for the main figure image is marked with a dotted box. This membrane was probed with the anti-FLAG antibody. Right – The same membrane as on the left, but overexposed and imaged with the light channel to show the entire membrane outline. The anti-FLAG antibody is very clean and therefore the membrane boarder is hard to see otherwise.

