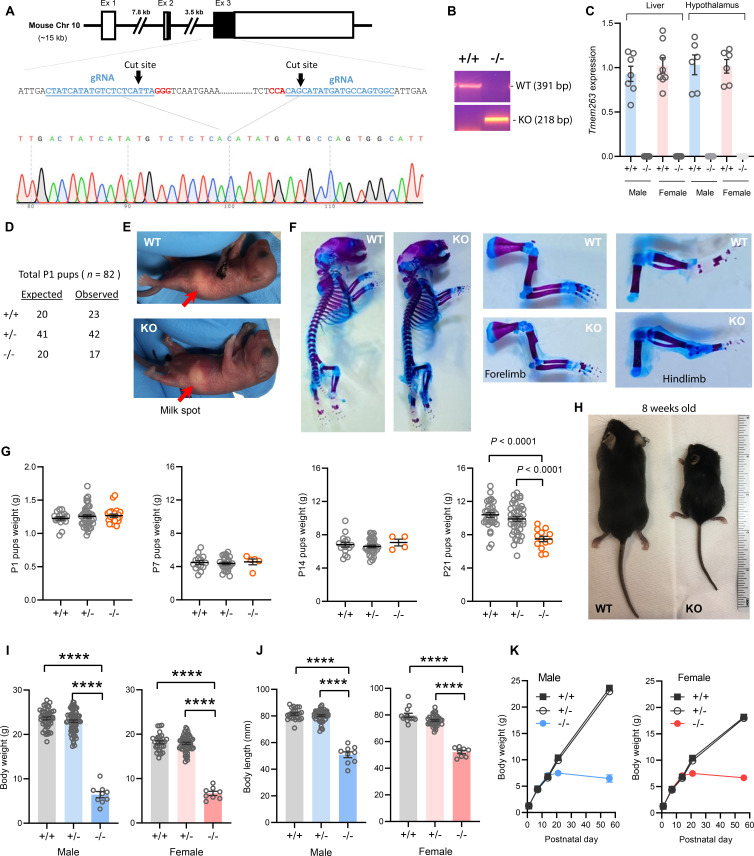
Figure 2. Deletion of Tmem263 gene causes dwarfism.
(A) Generation of Tmem263 knockout (KO) mice. The exon 3 that encodes ~81% of the full-length protein was deleted using CRISPR/Cas9 method and confirmed with DNA sequencing. The location and sequence of the two guide RNAs (gRNA) used to generate the deletion were underlined. Filled-in black boxes indicate part of the exon that codes for Tmem263 protein, and white boxes indicate part of the exon that codes for 5’ and 3’ UTR of the transcript. (B) Wild-type (WT) and KO alleles were confirmed by PCR genotyping. (C) The complete loss of Tmem263 transcript in KO mice was confirmed by qPCR in male and female mouse liver and hypothalamus (WT, n=6–8; KO, n=6–8). (D) The expected Mendelian versus observed genotype distributions in postnatal day 1 (P1) pups (n=82). (E) Representative images of WT and Tmem263-KO pups at P1. Milk spots are indicated by a red arrow. (F) Representative Alcian blue and Alizarin red staining of axial skeletal and cartilage in WT and KO P1 pups. (G) Body weights of WT and Tmem263-KO pups at P1 (WT = 17; Het = 42; KO = 23), P7 (WT = 15; het = 28; KO = 5), P14 (WT = 16; het = 34; KO = 4), and P21 (WT = 33; het = 41; KO = 13). For panel G, we combined the data of male and female pups from P1 to P21. (H) Representative images of adult WT and Tmem263-KO mice at 9 weeks of age. (I–J) Body weights and body length of WT (+/+), heterozygous (+/-), and KO (-/-) male and female mice at 9 weeks of age. Sample size for males (WT = 45; het = 73; KO = 9) and females (WT = 30; het = 59; KO = 8). (K) The growth curve trajectory based on the combined data in G and I. All data are presented as mean ± SEM. ****p<0.0001 (one-way ANOVA with Tukey’s multiple comparisons test).


