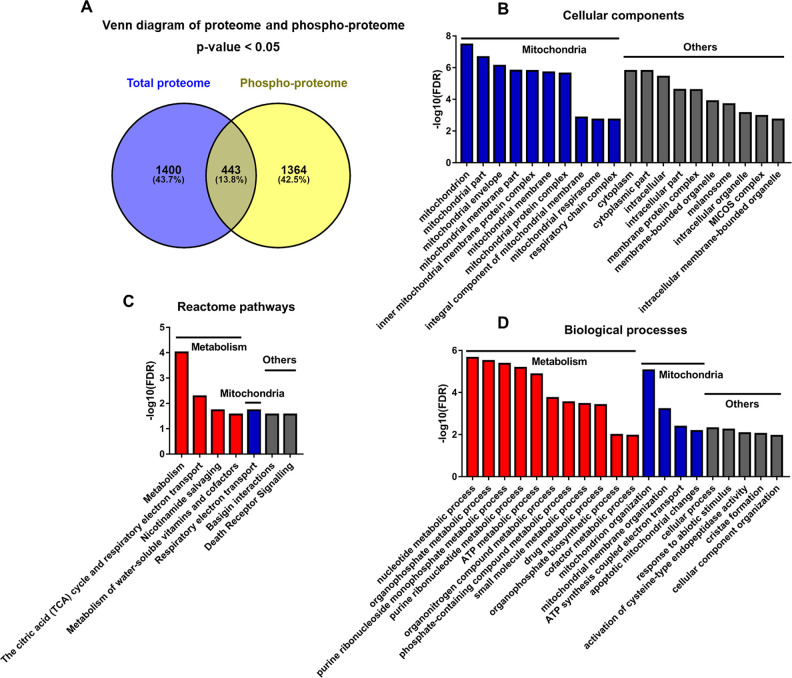
Figure 7. Analyses of proteins changed discordantly in proteome and phosphoproteome.
(A) Venn diagram of significantly regulated proteins in total proteome and significantly regulated phosphoproteins in unnormalized phosphoproteome that were conducted concurrently in the same platform. (B–D) Functional analyses of proteins whose expressions are changed discordantly at total protein and phosphorylation levels. Mitochondria and others are enriched in cellular component analysis (B). Functions related to metabolism, mitochondria, and others are enriched in Reactome pathway (C) and biological process analyses (D).

