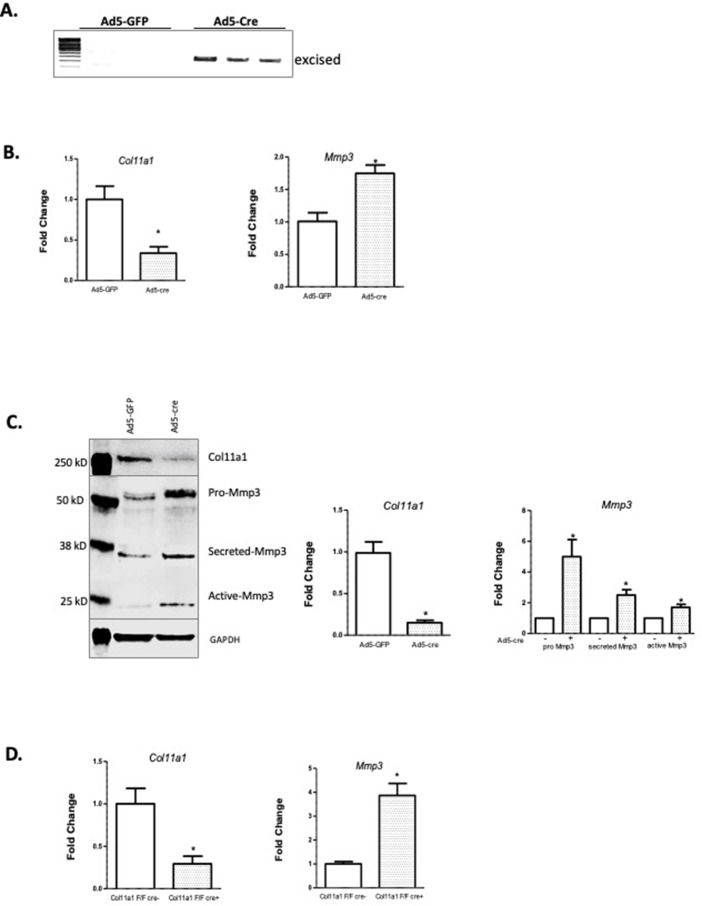
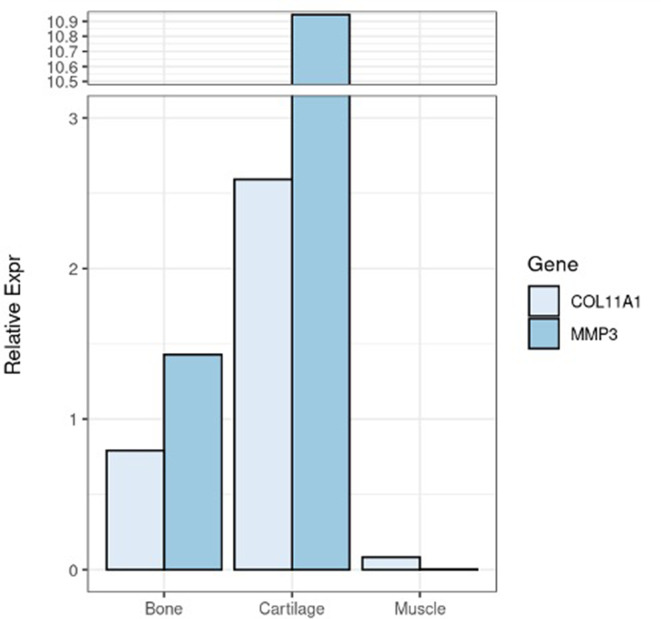
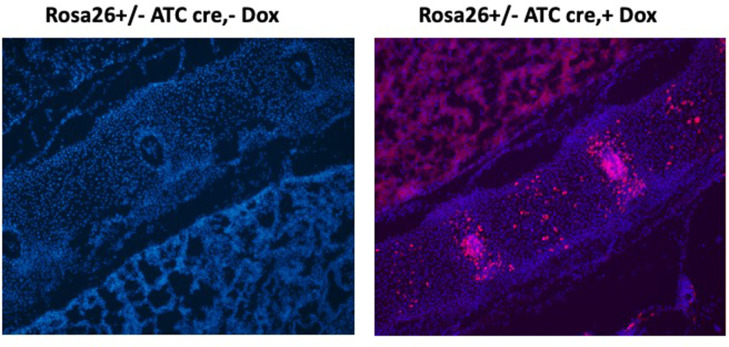
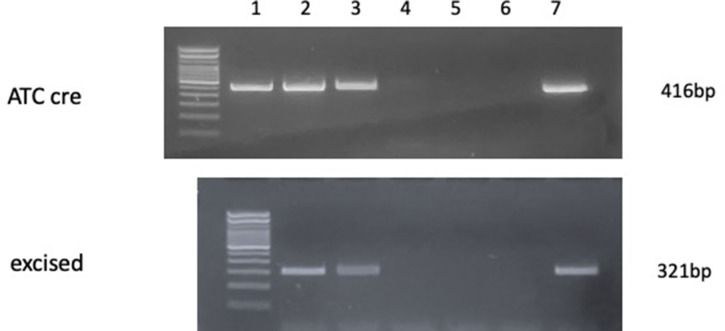
Figure 4. Col11a1 regulation of Mmp3 expression in cartilage.
(A) PCR assay of Col11a1 excision in Col11a1fl/fl cultured costal chondrocytes. (B) Gene expression levels from Col11a1fl/fl cultured costal chondrocytes transduced with green fluorescent protein (GFP) (Ad5-GFP, left) or Cre-expressing adenovirus (Ad5-cre, right) as determined by quantitative real-time PCR (qRT-PCR). Values represent the ratio of each gene expression to that of GAPDH, and values are mean ± standard deviation. The expression value of control Ad5-GFP results was arbitrarily set at 1.0. Statistical differences were determined using a two-sided paired t-test (*p<0.05). Results shown for N≥3 biologic replicates, each including three technical replicates. (C) Western blot detection of collagen a1(XI), MMP3, and GAPDH loading control in cultured costal chondrocytes after Ad5-GFP or Ad5-cre transduction. Results are representative of N=4 biologic replicates. Protein size ladder is shown in lane 1. Quantification of bands detected by western blotting, where Ad5-GFP was set to 1.0, is shown at right. Statistical differences were determined using a two-sided paired t-test (*p<0.05). (D) Gene expression levels from dissected Col11a1fl/fl:ATC costal cartilage, analyzed as described in (A). Results shown for N=3 biologic replicates, each including three technical replicates.


