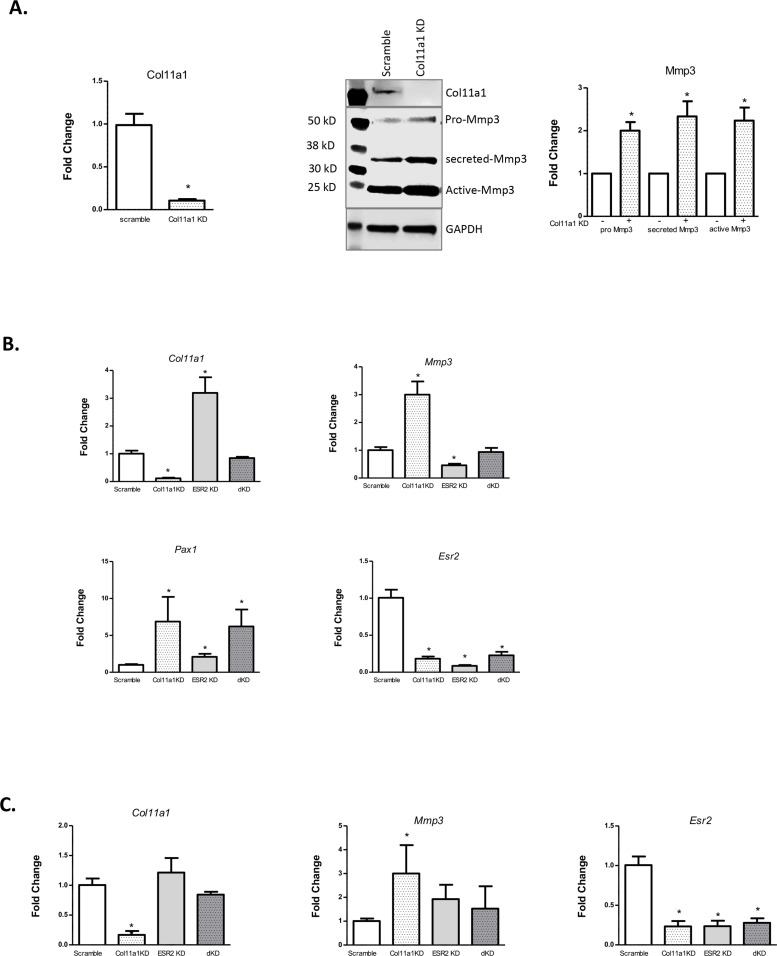
Figure 6. Effects of estrogen receptor beta on Col11a1-Mmp3 signaling axis.
(A) RT-qPCR (left) of Col11a1 expression after siRNA-mediated knockdown as shown at left. Representative western blot (of N=4 biologic replicates) of cultured costal chondrocytes after scramble or Col11a1-specific siRNA knockdown is shown in middle. Protein size ladder is shown in lane 1. Quantification of bands detected by western blotting is shown at right, where scramble results were set to 1.0. Values are mean after normalization to GAPDH, ± standard deviation. (B) Gene expression levels of Col11a1, Mmp3, Pax1, and Esr2 mRNA in cultured costal chondrocytes showing fold change relative to the scramble control. dKD = double Col11a1-Esr2-specific siRNA knockdowns. Each value represents the ratio of each gene expression to that of GAPDH, and values are mean ± standard deviation. Results are representative of N≥3 biologic replicates, each including three technical replicates. (C) Gene expression levels from rat cartilage endplate (CEP) cells, as described in (B).
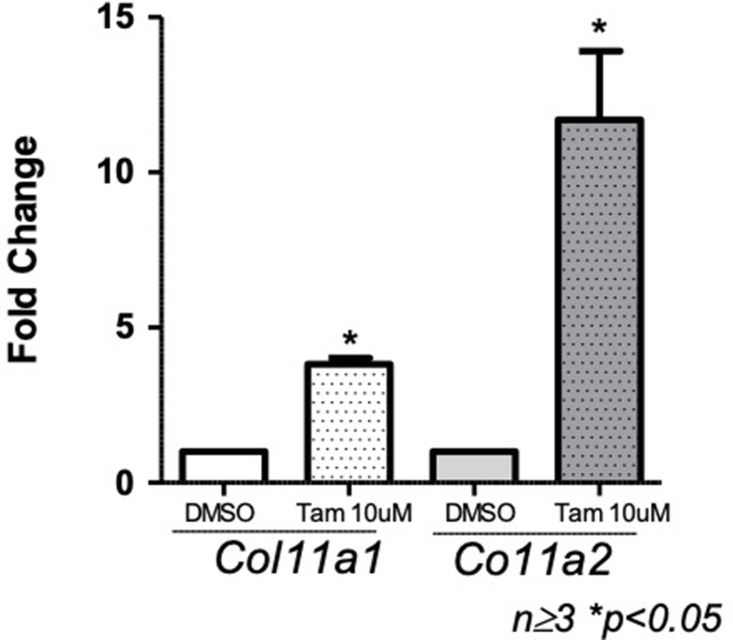
Figure 6—figure supplement 1. Quantitative real-time PCR (qRT-PCR) of Col11a1 and Col11a2 mRNA in cultured costal chondrocytes treated with DMSO carrier or tamoxifen (N≥3 independent experiments).
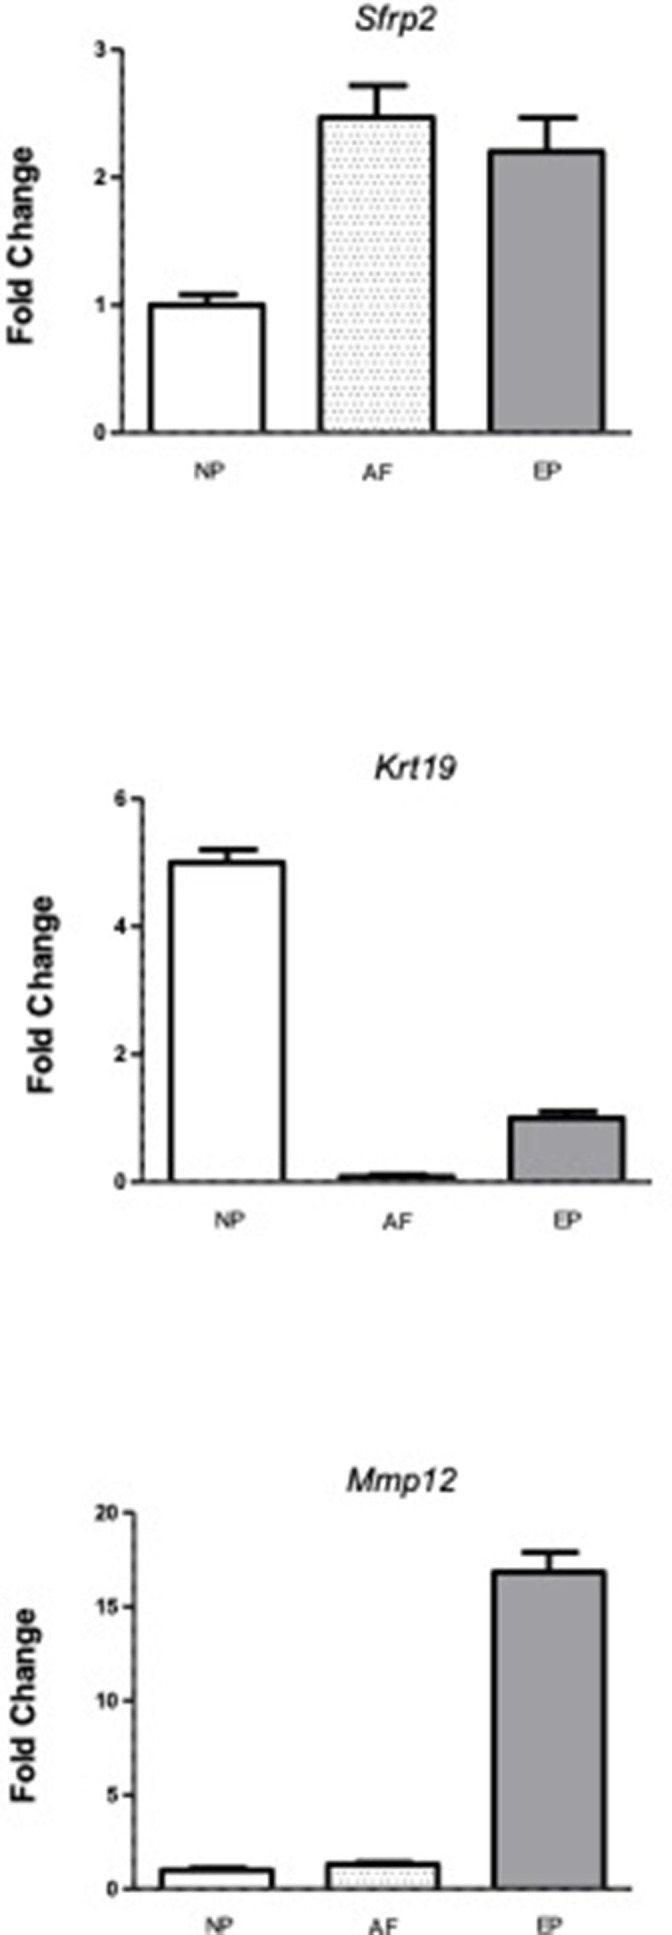
Figure 6—figure supplement 2. Quantitative real-time PCR (qRT-PCR) of Sfrp2, Krt19, and Mmp12 mRNA to validate expression of these marker genes in cultured rat nucleus pulposus (NP), annulus fibrosus (AF), and cartilage endplate (CEP) cells.


