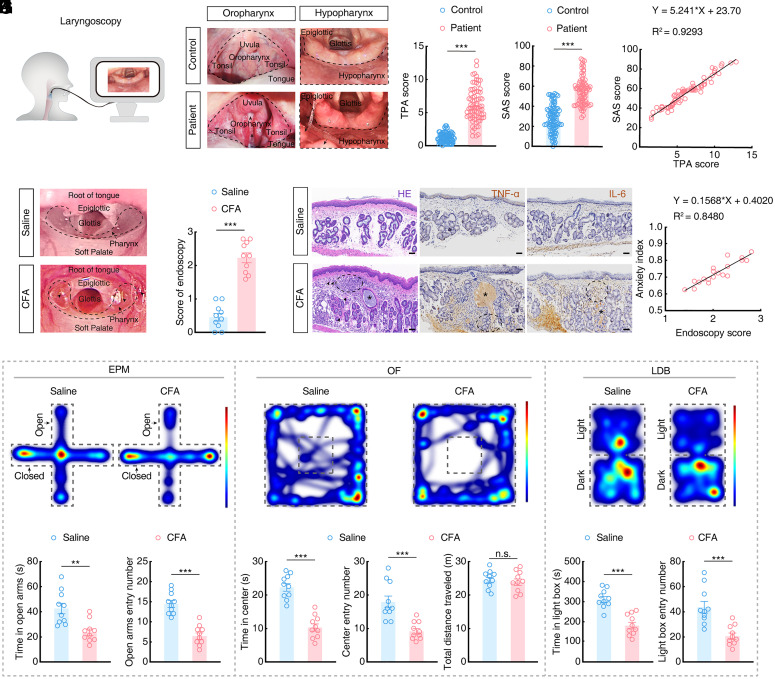
Fig. 1.
Pharyngeal inflammation is associated with anxiety in humans and mice. (A) Schematic of the laryngoscopy of enrolled subjects. (B) Representative laryngoscopic images showing the oropharynx and hypopharynx in healthy controls and patients with pharyngitis. The dashed box shows the oropharynx and hypopharynx of subjects, which are more congested in patients with pharyngitis than those in the healthy group; the long arrow (➛) indicates hyperplastic lymphoid follicles, and the short arrow (➤) indicates secretions. (C) The Tonsillo-Pharyngitis Assessment (TPA) score in healthy controls and patients with pharyngitis (control, n = 86; patient, n = 76; t160 = 17.42, P < 0.0001). (D) The Self-Rating Anxiety Scale (SAS) score in healthy controls and patients with pharyngitis (control, n = 86; patient, n = 76; t160 = 13.11, P < 0.0001). (E) Correlation between the TPA score and SAS score of patients (n = 76, Pearson’s: R2 = 0.9293, P < 0.0001). (F) Representative pharyngeal endoscopic images of saline and CFA mice. The dashed box and the long arrow (➛) indicate the pharynx of mice, which is more congested in CFA mice than in the saline group, with the short arrow (➤) indicating secretions. (G) The endoscopy score for saline and CFA mice (n = 10 mice per group; t18 = 9.637, P < 0.0001). (H) Representative images showing hematoxylin-eosin (H&E), tumor necrosis factor-α (TNF-α, inflammatory cytokine), and interleukin-6 (IL-6, inflammatory cytokine) staining of the pharyngeal mucosa of saline and CFA mice. The short arrow (➤) indicates hemorrhagic spots, and the asterisk (*) indicates retention of secretions in the mucous glands, and the dashed box indicates high infiltration of inflammatory cells or factors. (Scale bars, 50 µm.) (I) Representative heatmaps of the travel trajectory of saline and CFA mice and summarized data for the time spent in and the number of entering the open arms in the elevated plus maze (EPM) test (n = 10 mice per group; Left, t18 = 3.798, P = 0.0013; Right, t18 = 6.905, P < 0.0001). (J) Representative heatmaps of the travel trajectory and summarized data for the time spent in and the number of entering the center of the open field (OF) and the total distance traveled by saline and CFA mice in the OF test (n = 10 mice per group; Left, t18 = 7.646, P < 0.0001; Middle, t18 = 4.495, P = 0.0003; Right, t18 = 0.4801, P = 0.6369). (K) Representative heatmaps of the travel trajectory of saline and CFA mice and summarized data for the time spent in and the number of entering the light box in the light–dark box (LDB) test (n = 10 mice per group; Left, t18 = 5.951, P < 0.0001; Right, t18 = 4.373, P = 0.0004). (L) Correlation between the endoscopy score and anxiety index of mice with injected different doses (5 μL, 10 μL) of CFA (n = 20, Pearson’s: R2 = 0.8480, P < 0.0001). Significance was assessed by two-tailed unpaired Student’s t tests in (C, D, G, and I–K), and Pearson’s correlations in (E and L). All data are presented as the mean ± SEM. **P < 0.01; ***P < 0.001, n.s., not significant.

