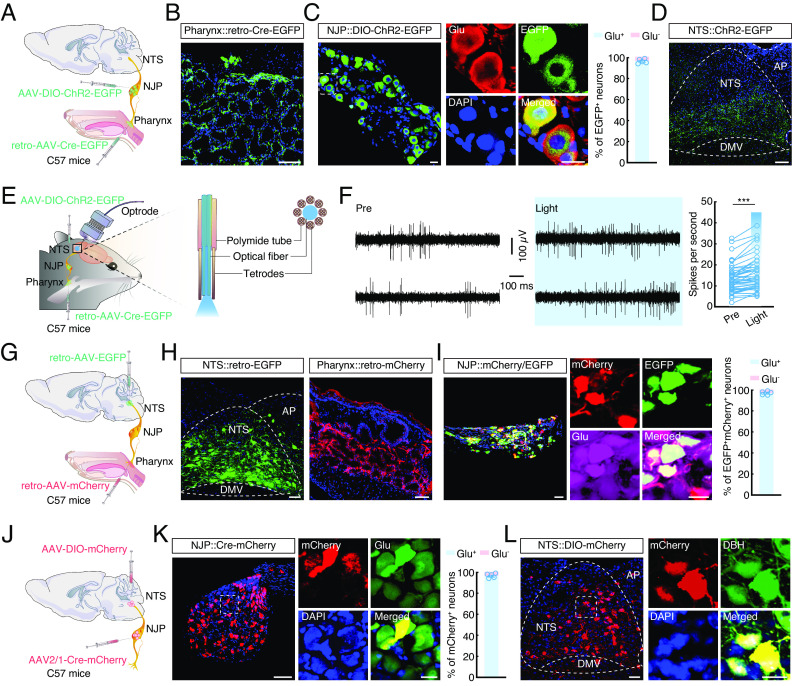
Fig. 2.
Defining functional connections of the pharynx→NJP→NTSNE circuit. (A) Schematic of the viral injection. (B) Representative image showing the infusion site within the pharynx. (Scale bar, 100 µm.) (C) Representative images showing the EGFP+ neurons in the nodose/jugular/petrosal (NJP) superganglia and ~99% of EGFP+ neurons colocalized with glutamate antibody signal. (Scale bars, 20 µm.) (D) Representative image of EGFP+ fiber expression in the nucleus of the solitary tract (NTS). (Scale bar, 100 µm.) (E) Schematic of viral injection and multitetrode recording in freely moving mice. (F) Example recordings of spontaneous and light-evoked spikes (Left) and summarized data recorded (Right) from the neurons in the NTS before and during light photostimulation of the NJP fibers (493 nm light; n = 46 cells; t45 = 7.252, P < 0.0001). (G) Schematic of the viral injection. (H) Typical images showing the infusion site within the NTS (Left) and pharynx (Right). (Scale bars, 50 μm [Left] or 100 μm [Right].) (I) Representative confocal images show EGFP+ from the NTS being detected by mCherry+ neurons innervating the pharynx (Left) and ~99% of EGFP+mCherry+ neurons in the NJP colocalized with glutamate antibody signal (Right). (Scale bars, 50 μm [Left] or 20 μm [Right].) (J) Schematic of the viral injection. (K) Representative images showing the infusion site within the NJP neurons (Left) and ~99% of mCherry+ neurons colocalized with glutamate antibody signal (Right). (Scale bars, 100 μm [Left] or 20 μm [Right].) (L) Representative images of mCherry+ neurons expressed in the NTS (Left) and predominantly colocalized with dopamine β-hydroxylase (DBH) antibody (Right). (Scale bars, 50 µm [Left] or 20 µm [Right].) Significance was assessed by two-tailed paired Student’s t tests in (F). All data are presented as the mean ± SEM. ***P < 0.001.

