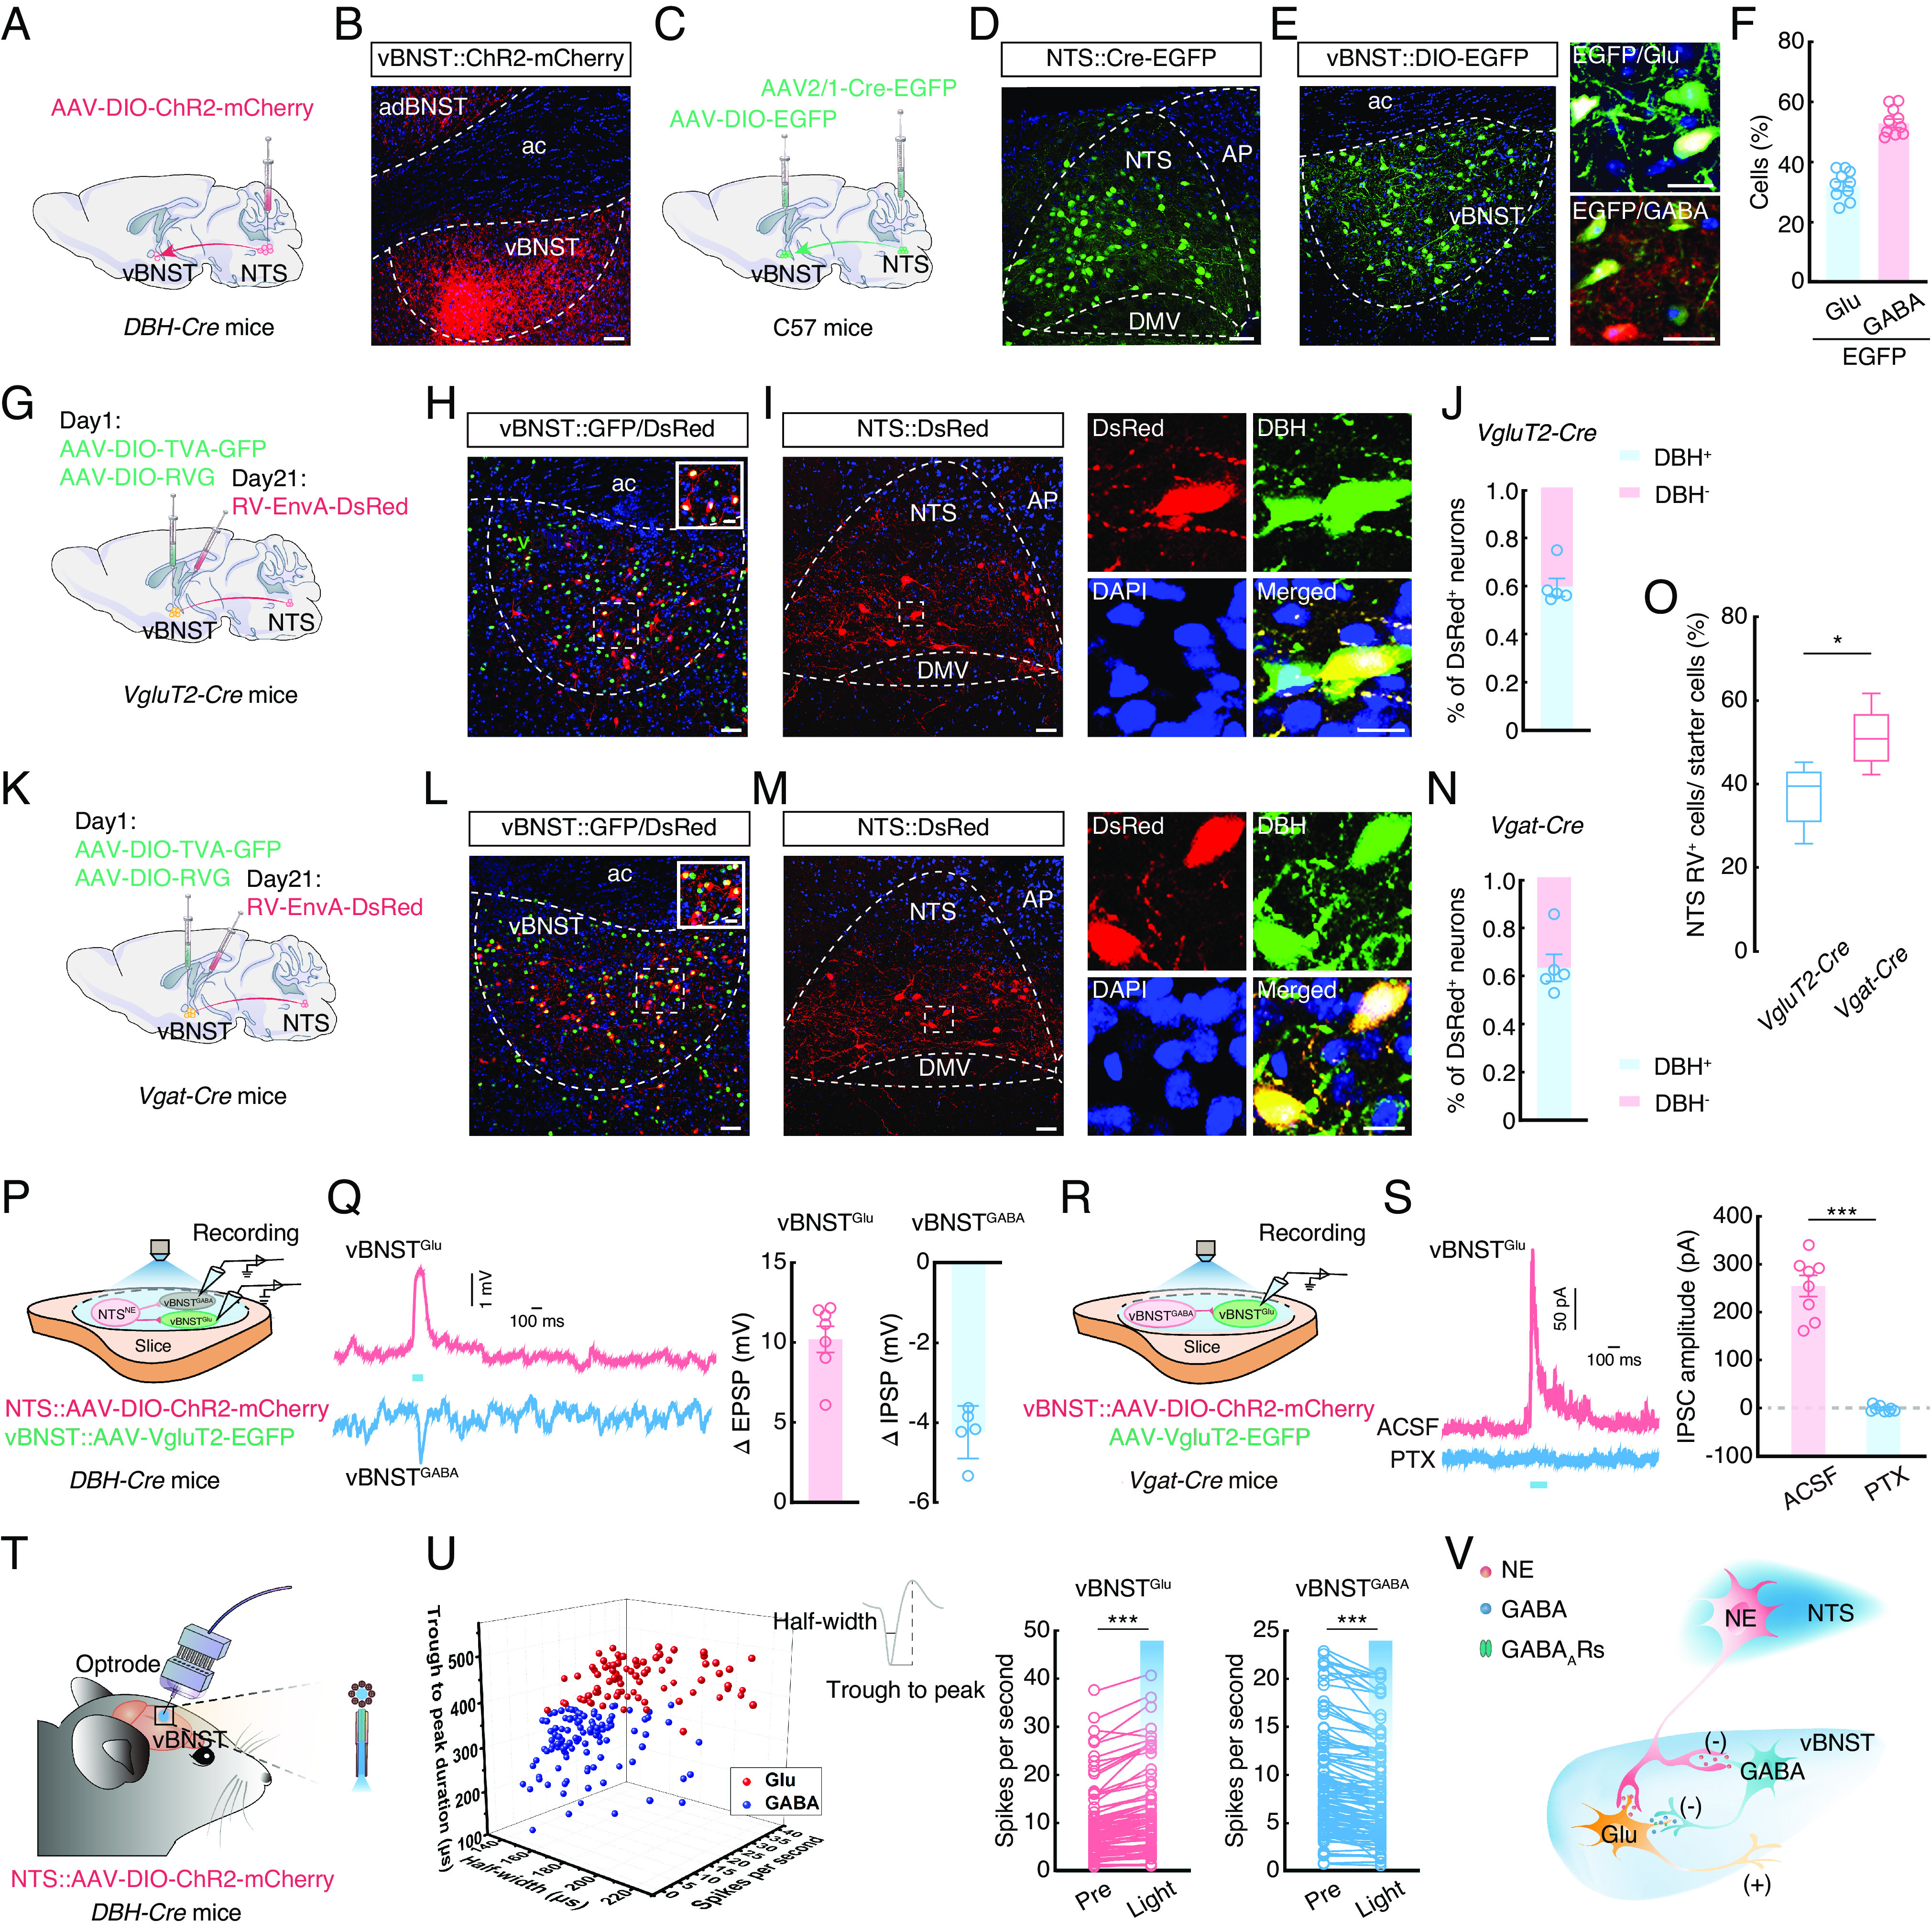
Fig. 4.

Defining functional connections of the NTSNE→vBNST circuit. (A) Schematic of the viral injection. (B) Representative image of mCherry+ fiber expression in the ventral bed nucleus of the stria terminalis (vBNST) of DBH-Cre mice. (Scale bar, 50 µm). (C) Schematic of the viral injection. (D) Representative images showing the infusion site within the NTS. (Scale bar, 50 µm.) (E) Representative images showing the infusion site within the vBNST (Left) and EGFP-labeled neurons within the vBNST colocalize with glutamate or GABA antibody (Right). (Scale bars, 50 µm [Left] or 20 µm [Right].) (F) Statistics showing that EGFP-labeled neurons within the vBNST colocalized with glutamate and GABA antibody (n = 10 slices from five mice). (G) Schematic of the viral injection. (H) Representative images showing the infusion site within the vBNST of VgluT2-Cre mice. Starter cells (yellow) coexpress AAV-DIO-TVA-GFP, AAV-DIO-RVG (green), and RV-EnvA-ΔG-DsRed (red). (Scale bar, 50 µm.) The white box depicts the area shown in the box of the vBNST. (Scale bar, 20 µm.) (I) Representative images of the DsRed+ neurons in the NTS and colocalized with the DBH antibody of VgluT2-Cre mice. (Scale bars, 50 µm [Left] or 20 µm [Right].) (J) Quantitative analysis showing ~60% of DsRed+ neurons colocalized with DBH antibody signal in the NTS for cell type–specific retrograde trans-monosynaptic tracing of projections to the vBNST in VgluT2-Cre mice. (K) Schematic of the viral injection. (L) Representative images showing the infusion site within the vBNST of Vgat-Cre mice. Starter cells (yellow) coexpress AAV-DIO-TVA-GFP, AAV-DIO-RVG (green), and RV-EnvA-ΔG-DsRed (red). (Scale bar, 50 µm.) The white box depicts the area shown in the box of the vBNST. (Scale bar, 20 µm.) (M) Representative images showing the DsRed+ neurons in the NTS and colocalized with the DBH antibody of Vgat-Cre mice. (Scale bars, 50 µm [Left] or 20 µm [Right].) (N) Quantitative analysis showing ~64% of DsRed+ neurons colocalized with DBH antibody in the NTS for cell type–specific retrograde trans-monosynaptic tracing of projections to the vBNST in Vgat-Cre mice. (O) Statistical data showing the ratio of RV+ neurons in the NTS to starter cells in the vBNST of VgluT2-Cre and Vgat-Cre mice (n = 5 images from five mice per group; t8 = 2.936, P = 0.0188). (P) Schematic of the viral injection and recording configuration in acute slices. (Q) Representative traces (Left) and summarized data (Right) recorded from neurons after photostimulation (473 nm light, 100 ms, blue bar) of NTSNE fibers (ΔEPSP, n = 7 cells, ΔIPSP, n = 5 cells). (R) Schematic of the viral injection and recording configuration in acute slices. (S) Representative traces (Left) and summarized data (Right) recorded from the vBNSTGlu of light-evoked currents (473 nm light, 100 ms, blue bar) before and after PTX (picrotoxin, 10 µM) treatment (n = 8 cells, t7 = 10.97, P < 0.0001). (T) Schematic of the viral injection and multitetrode recording in freely moving mice. (U) All recorded light-sensitive neurons (n = 189) were classified as wide-spiking putative glutamatergic cells (red, n = 81) and GABAergic cells (blue, n = 108) (Left). Summarized data (Right) recorded from the neurons in vBNST before and during light photostimulation of NTSNE fibers (vBNSTGlu, t80 = 8.895, P < 0.0001; vBNSTGABA, t107 = 9.522, P < 0.0001). (V) Schematic of NTSNE projections onto vBNST. EPSP, excitatory postsynaptic potential. IPSP, inhibitory postsynaptic potential. IPSC, inhibitory postsynaptic current. Significance was assessed by two-tailed unpaired Student’s t tests in (O) and two-tailed paired Student’s t tests in (S and U). All data are presented as the mean ± SEM. *P < 0.05, ***P < 0.001.
